Offensive Security Gauntlet 2025 - Stealers' Shadow
Stealers' Shadow
Part of OffSec's CTF this year involved a forensic investigation of a compromised machine.
We were given the following prompt:
Download the ZIP package. The password is "**Shadow234@**".

Thanks to your actions during the ProtoVault incident, you've gained the trust of the Etherians. The OffSec Legend, Cipherflare has called upon you to investigate the breach before more damage is done.

The Etherians offer fragments of evidence, just enough to begin the investigation:

- The user directory of **[email protected]** from the machine **WK001**
- Event logs from **WK001**

A ZIP archive awaits you.

Uncover the truth hidden in the darkness. Find what was taken, and how.
Inside the zip, we have some files-
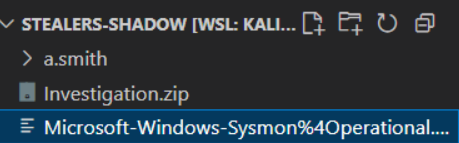 inside
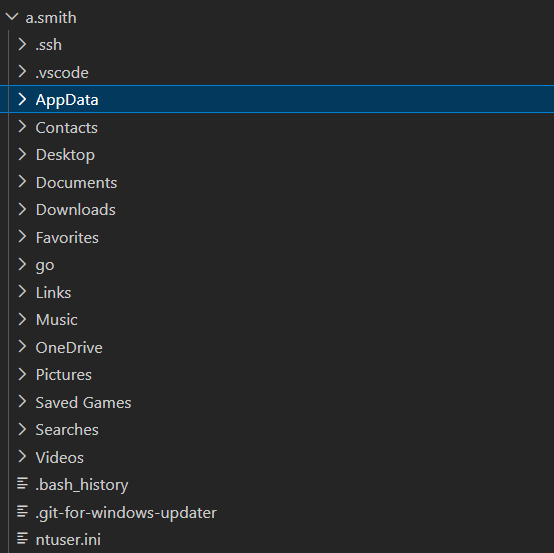
 a.smith directory, we get the user's home folder
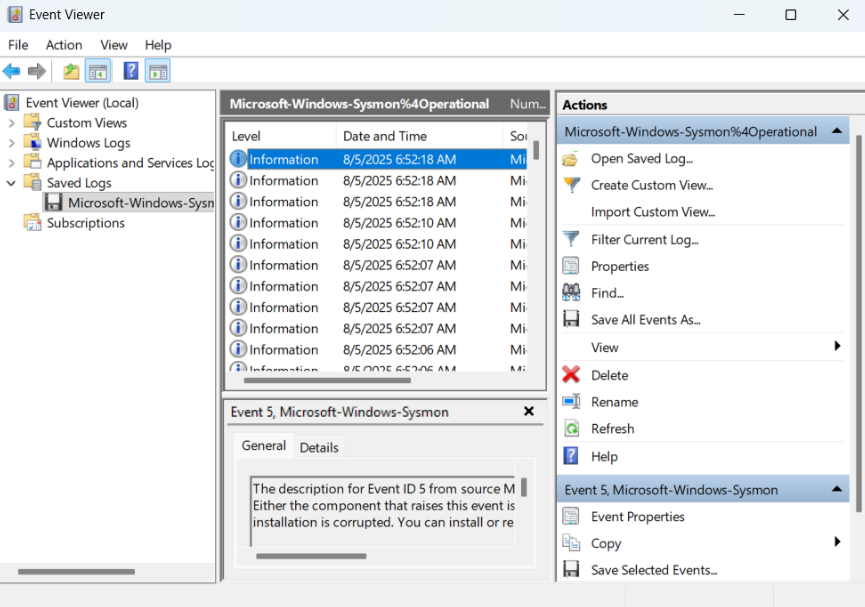
While the .evtx file is a sysmon log for that system.
Part 1 - Summarized for brevity
I use evtx_dump to parse the file for readability:
juicecat@Sovngarde-2:~/CTF/offsec-gauntlet/stealers-shadow
% ~/Tools/evtx_dump -o jsonl -f logs_json.json logs.evtx
It can also be opened in the windows event viewer, but it's much easier to parse via CLI
We can use jq to filter and refine our search
juicecat@Sovngarde-2:~/CTF/offsec-gauntlet/stealers-shadow
% cat logs_json.json | jq '.Event.System["EventID"]' | head -n 50
23
11
11
11
11


juicecat@Sovngarde-2:~/CTF/offsec-gauntlet/stealers-shadow
% cat logs_json.json | jq '.Event | select(.System["EventID"] == 3)' | head -n 50
{
  "#attributes": {
    "xmlns": "http://schemas.microsoft.com/win/2004/08/events/event"
  },
  "System": {
    "Provider": {
      "#attributes": {
        "Name": "Microsoft-Windows-Sysmon",
        "Guid": "5770385F-C22A-43E0-BF4C-06F5698FFBD9"
      }
    },
    "EventID": 3,
    "Version": 5,
    "Level": 4,
    "Task": 3,
    "Opcode": 0,
    "Keywords": "0x8000000000000000",
    "TimeCreated": {
      "#attributes": {
        "SystemTime": "2025-07-31T08:56:30.629677Z"
      }
    },
    "EventRecordID": 41617,
    "Correlation": null,
    "Execution": {
      "#attributes": {
        "ProcessID": 6648,
        "ThreadID": 10256
      }
    },
    "Channel": "Microsoft-Windows-Sysmon/Operational",
    "Computer": "WK001.megacorpone.com",
    "Security": {
      "#attributes": {
        "UserID": "S-1-5-18"
      }
    }
  },
  "EventData": {
    "RuleName": "-",
    "UtcTime": "2025-07-31 08:56:50.550",
    "ProcessGuid": "00000000-0000-0000-0000-000000000000",
    "ProcessId": 11360,
    "Image": "<unknown process>",
    "User": "-",
    "Protocol": "tcp",
    "Initiated": true,
    "SourceIsIpv6": false,
    "SourceIp": "10.10.10.245",
    "SourceHostname": "WK001.megacorpone.com",


juicecat@Sovngarde-2:~/CTF/offsec-gauntlet/stealers-shadow
% jq -c 'select(.Event.System.EventID == 3                                                                                              25-10-14 - 14:46:29
            and .Event.EventData.Initiated == true
            and .Event.EventData.Image != "C:\\Windows\\System32\\svchost.exe"
            and .Event.EventData.Image != "C:\\Program Files (x86)\\Microsoft\\Edge\\Application\\msedge.exe"
            and .Event.EventData.Image != "C:\\Windows\\System32\\taskhostw.exe")' logs_json.json | wc -l
15981
Eventually, (saving time by skipping a large part of this challenge) we come across this event:
  },
    "EventData": {
      "RuleName": "-",
      "UtcTime": "2025-08-05 09:02:06.865",
      "ProcessGuid": "8404BF77-C85E-6891-0E37-000000000C00",
      "ProcessId": 17852,
      "User": "MEGACORPONE\\a.smith",
      "Image": "C:\\Users\\a.smith\\AppData\\Local\\Microsoft\\Windows\\INetCache\\IE\\66HCZK0X\\captcha_privacy[1].epub",
      "TargetFilename": "C:\\Users\\a.smith\\AppData\\Local\\Temp\\101010245WK001.zip",
      "Hashes": "SHA1=756FF3A252D10493CE9C34297FA7BB6F84DC27A4,MD5=053C53EC53D5E6C720AB105BC46FAE2B,SHA256=B6A1646F23BA0A05B7C80A7D6261204384AB06F15983EB195EB5F0A3FEDF2475,IMPHASH=00000000000000000000000000000000",
      "IsExecutable": false,
      "Archived": "true"
    }
  }
}
Which is strange- If you notice, this is a file creation event, and the Image field is an epub file, which is extremely abnormal. This leads us to investigate this epub file in question. As you might expect, the epub file is actually a PE32, that due to a malicious registry change, is being run as an executable.
That was a summary of several hours of digging through event logs and the user profile for crumbs, but the main purpose of this blog post is for the disassembly.
Part 2 - Malicious File Disassembly
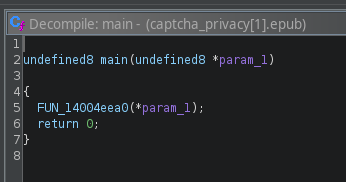
We upload this file to Ghidra for disassembly, and immediately check the entry function. This entry function just calls two functions,
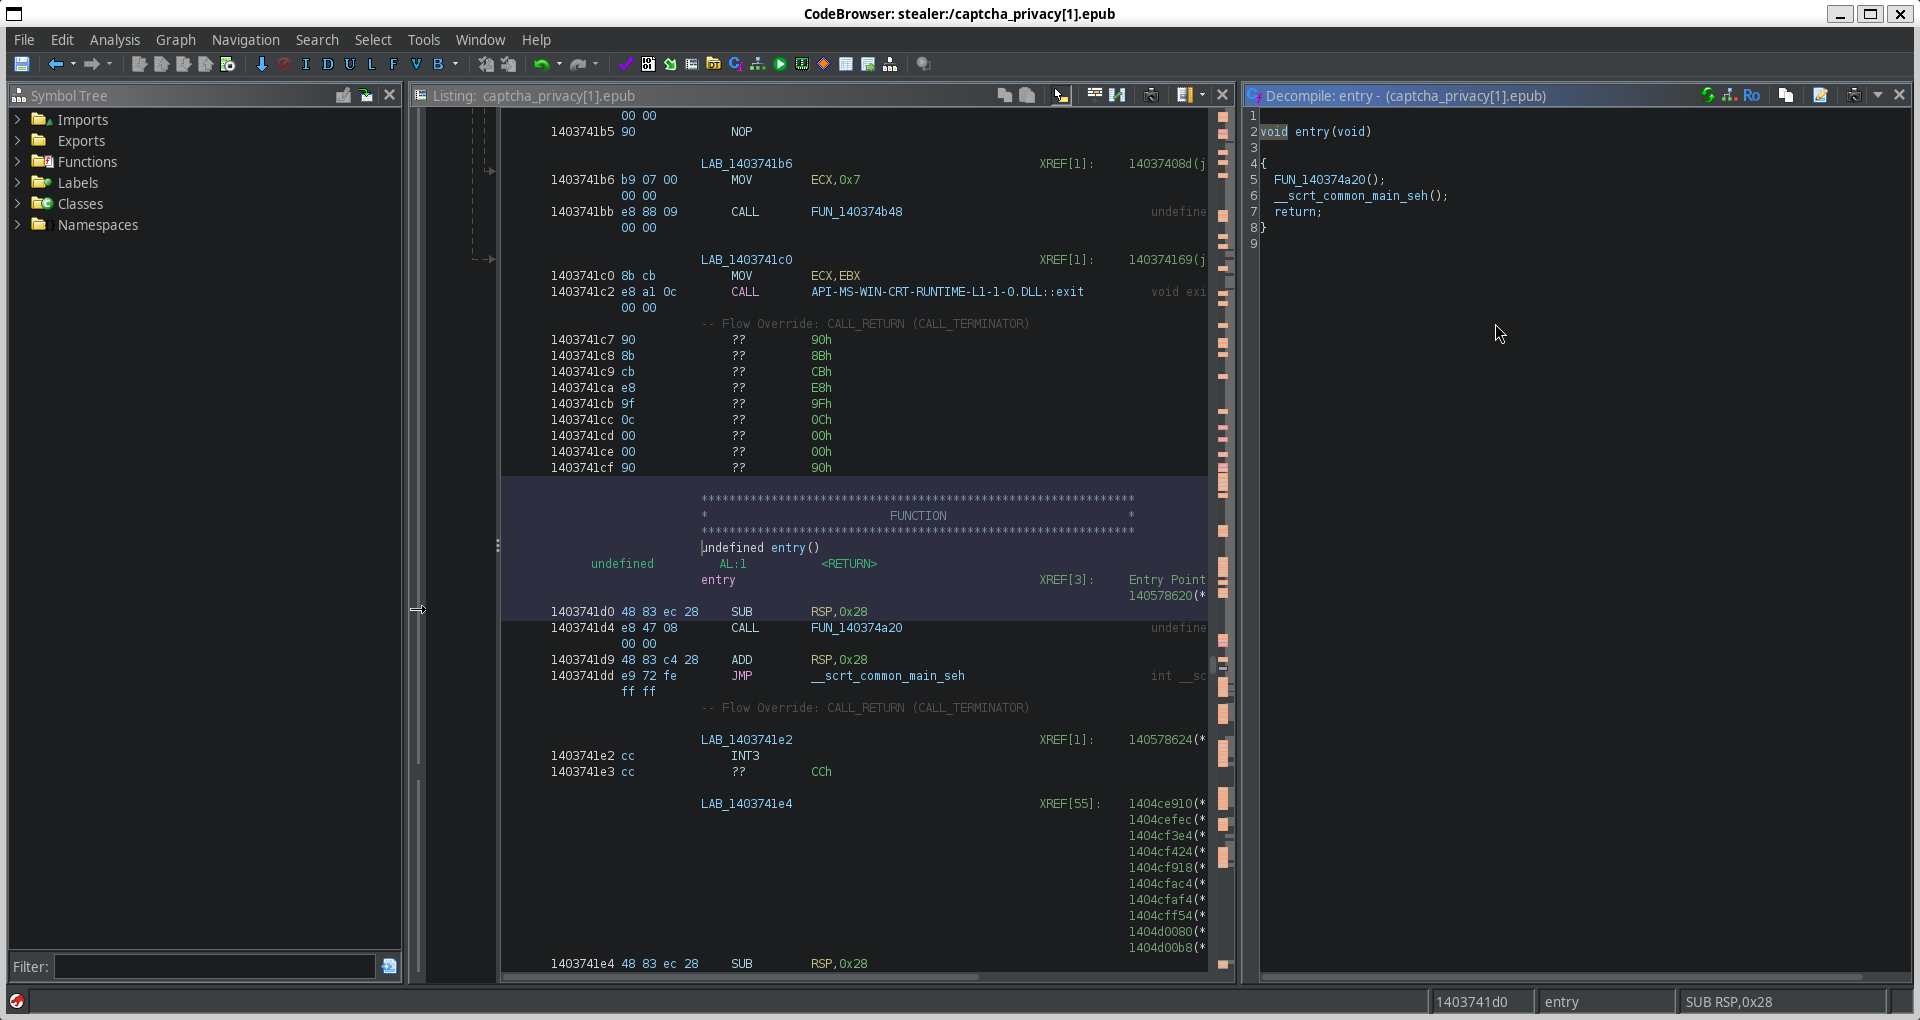 The first one is nothing interesting- just boilerplate
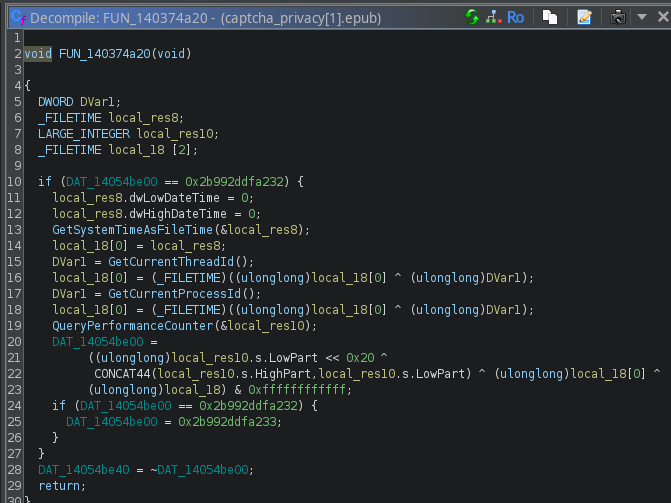
The next one is an injection function used to prepare the data
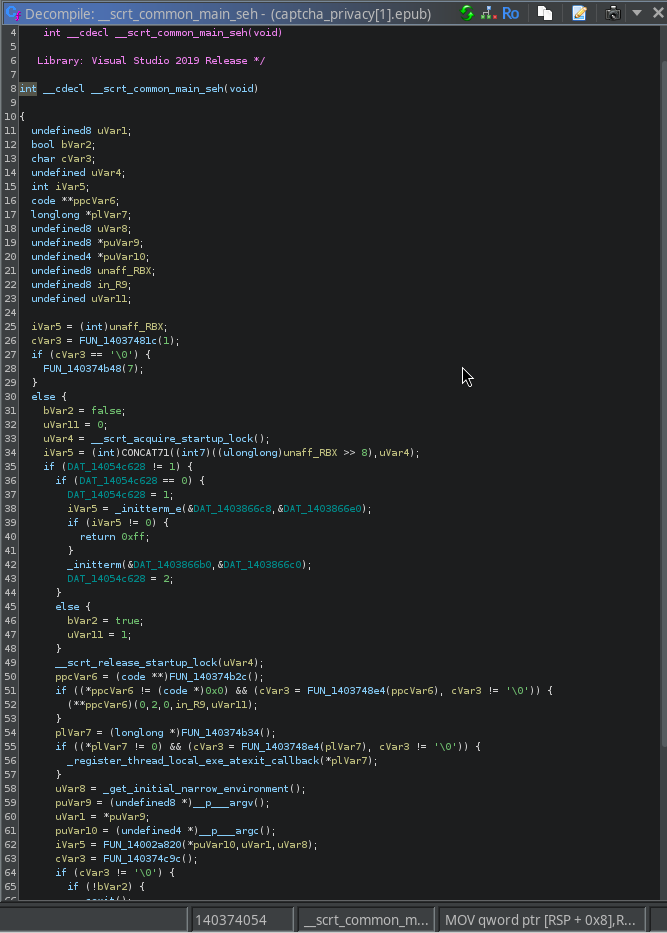
In the red, we see some setup. But whats interesting is the blue and what's below it.
We see these lines:
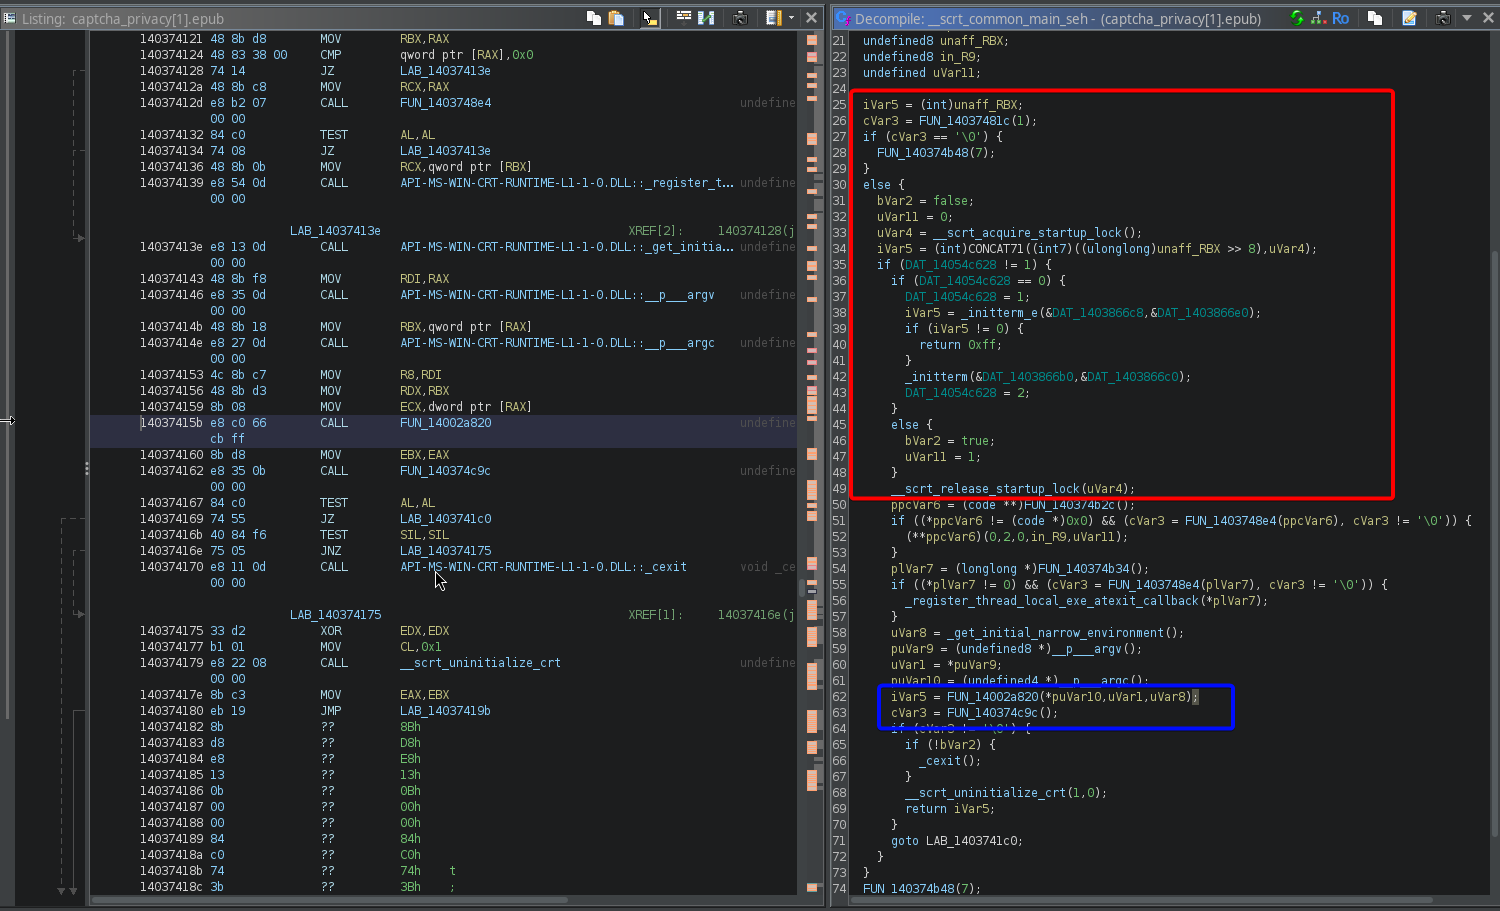
      uVar8 = _get_initial_narrow_environment();
      puVar9 = (undefined8 *)__p___argv();
      uVar1 = *puVar9;
      puVar10 = (undefined4 *)__p___argc();
      iVar5 = FUN_14002a820(*puVar10,uVar1,uVar8);
      cVar3 = FUN_140374c9c();
      if (cVar3 != '\0') {
        if (!bVar2) {
          _cexit();
        }
        __scrt_uninitialize_crt(1,0);
        return iVar5;
      }
This looks like it is setting up variables and then calling a function, passing in those variables. In this case, FUN_14002a820 is being called, and being given 3 arguments. Afterwards, it seems like FUN_140374c9c is being called and the output is being checked for a successful (no error) exit. Afterwards, the return value of the FUN_14002a820 func is returned.
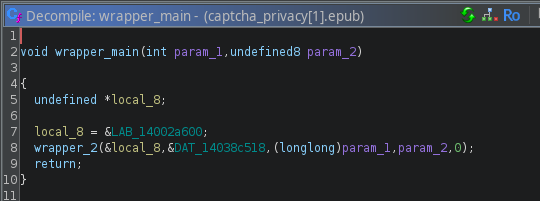
For ease of following, we'll rename FUN_14002a820 to wrapper_main, and then follow the xref.
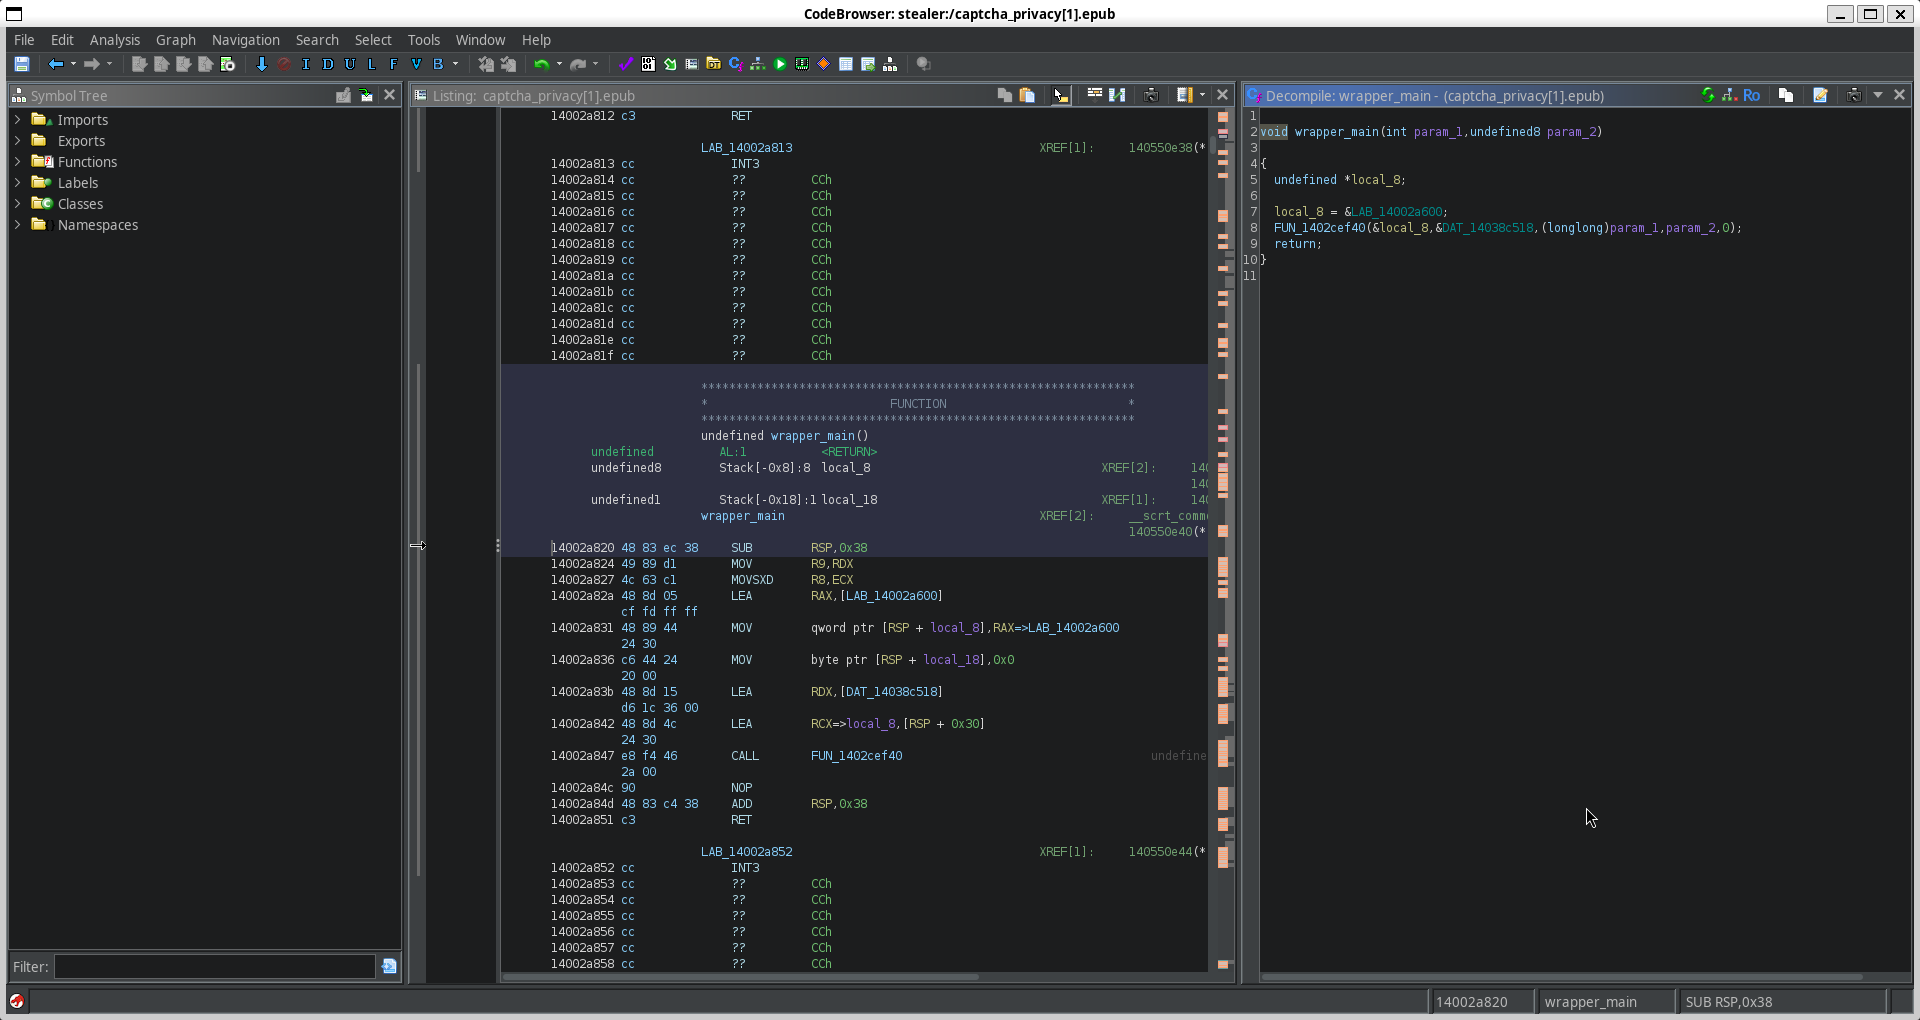 Looks like
 wrapper_main is itself a wrapper for another FUN_1402cef40. We'll rename this one to wrapper_2. We also see a few more parameters being passed in, but we'll come back to those later. Let's check out what's inside of wrapper_2
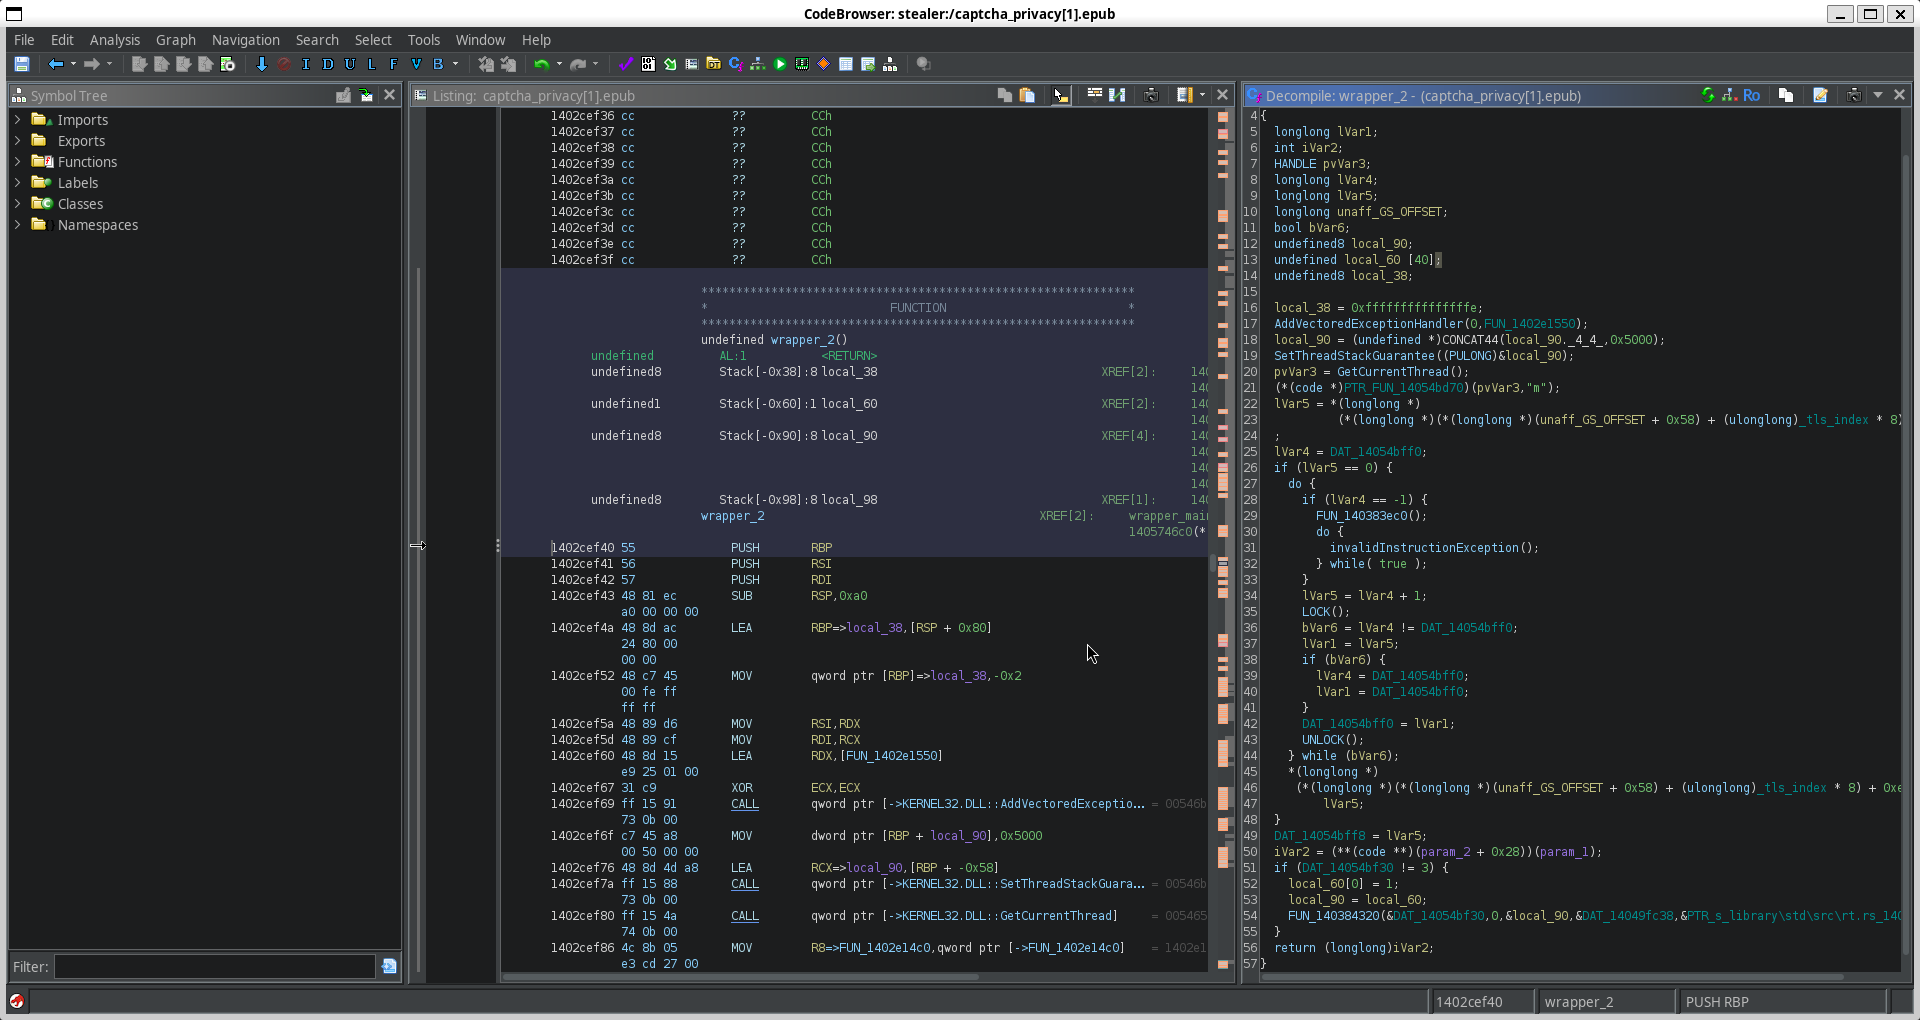 Here we've got much more to work with-
I'll save you the headache and just explain what this is doing. First, it sets up the stack and prepares error handling:
AddVectoredExceptionHandler(0, FUN_1402e1550);
local_90 = (undefined *)CONCAT44(local_90._4_4_, 0x5000);
SetThreadStackGuarantee((PULONG)&local_90);
Then, it initializes a thread:
  pvVar3 = GetCurrentThread();
  (*(code *)PTR_FUN_14054bd70)(pvVar3,"m");
The next several lines do a couple things- First, it sets up access to TLS (Thread Local Storage) via the GS segment. Then it sets up a loop to increment DAT_14054bff0 with locking, and writes it back to the TLS location. Effectively, this just registers the thread in a global runtime context and ensures thread-safe initialization.
  lVar5 = *(longlong *)
           (*(longlong *)(*(longlong *)(unaff_GS_OFFSET + 0x58) + (ulonglong)_tls_index * 8) + 0xe8)
  ;
  lVar4 = DAT_14054bff0;
  if (lVar5 == 0) {
    do {
      if (lVar4 == -1) {
        FUN_140383ec0();
        do {
          invalidInstructionException();
        } while( true );
      }
      lVar5 = lVar4 + 1;
      LOCK();
      bVar6 = lVar4 != DAT_14054bff0;
      lVar1 = lVar5;
      if (bVar6) {
        lVar4 = DAT_14054bff0;
        lVar1 = DAT_14054bff0;
      }
      DAT_14054bff0 = lVar1;
      UNLOCK();
    } while (bVar6);
    *(longlong *)
     (*(longlong *)(*(longlong *)(unaff_GS_OFFSET + 0x58) + (ulonglong)_tls_index * 8) + 0xe8) =
         lVar5;
  }
Now here's the important part
iVar2 = (**(code **)(param_2 + 0x28))(param_1);
We've seen this before, but this one requires a little understanding of low-level programming languages. What this line of code does is essentially find the piece of data located by the param_2 (acting as a pointer), and adds the offset 0x28 to this. It fetches whatever data is that this point, and calls it as a function, passing in param_1 as an argument.
This is a long winded way of explaining that it's very obfuscated, and we have yet to even see the real 'main' function.
To find it, we'll need to find out what param_2 + 0x28 resolves to, which means finding param_2
Well, remember that we're already 3 wrappers deep. So let's just check the wrapper above this one to find out where the parameter comes from:
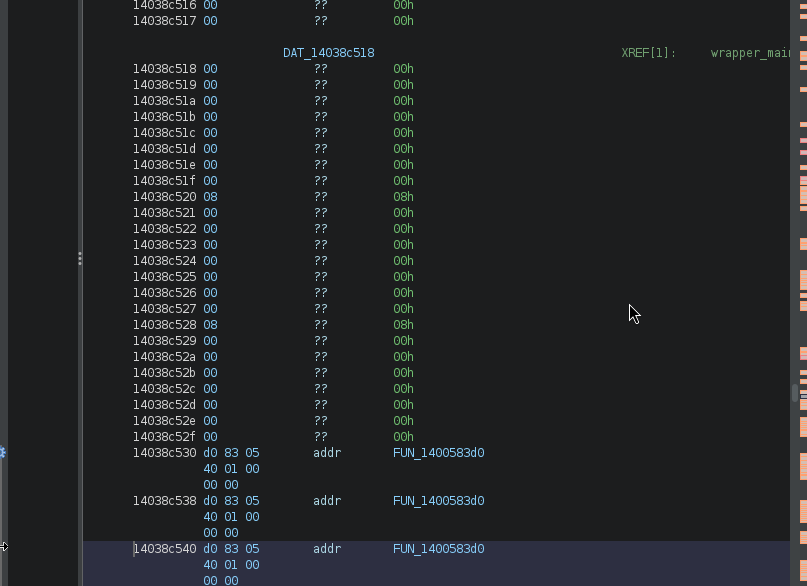
 Here, we see that
 &DAT_14038c518 is passed as param_2. We can navigate to this pointer by double clicking on it, and it takes us to where that data is stored
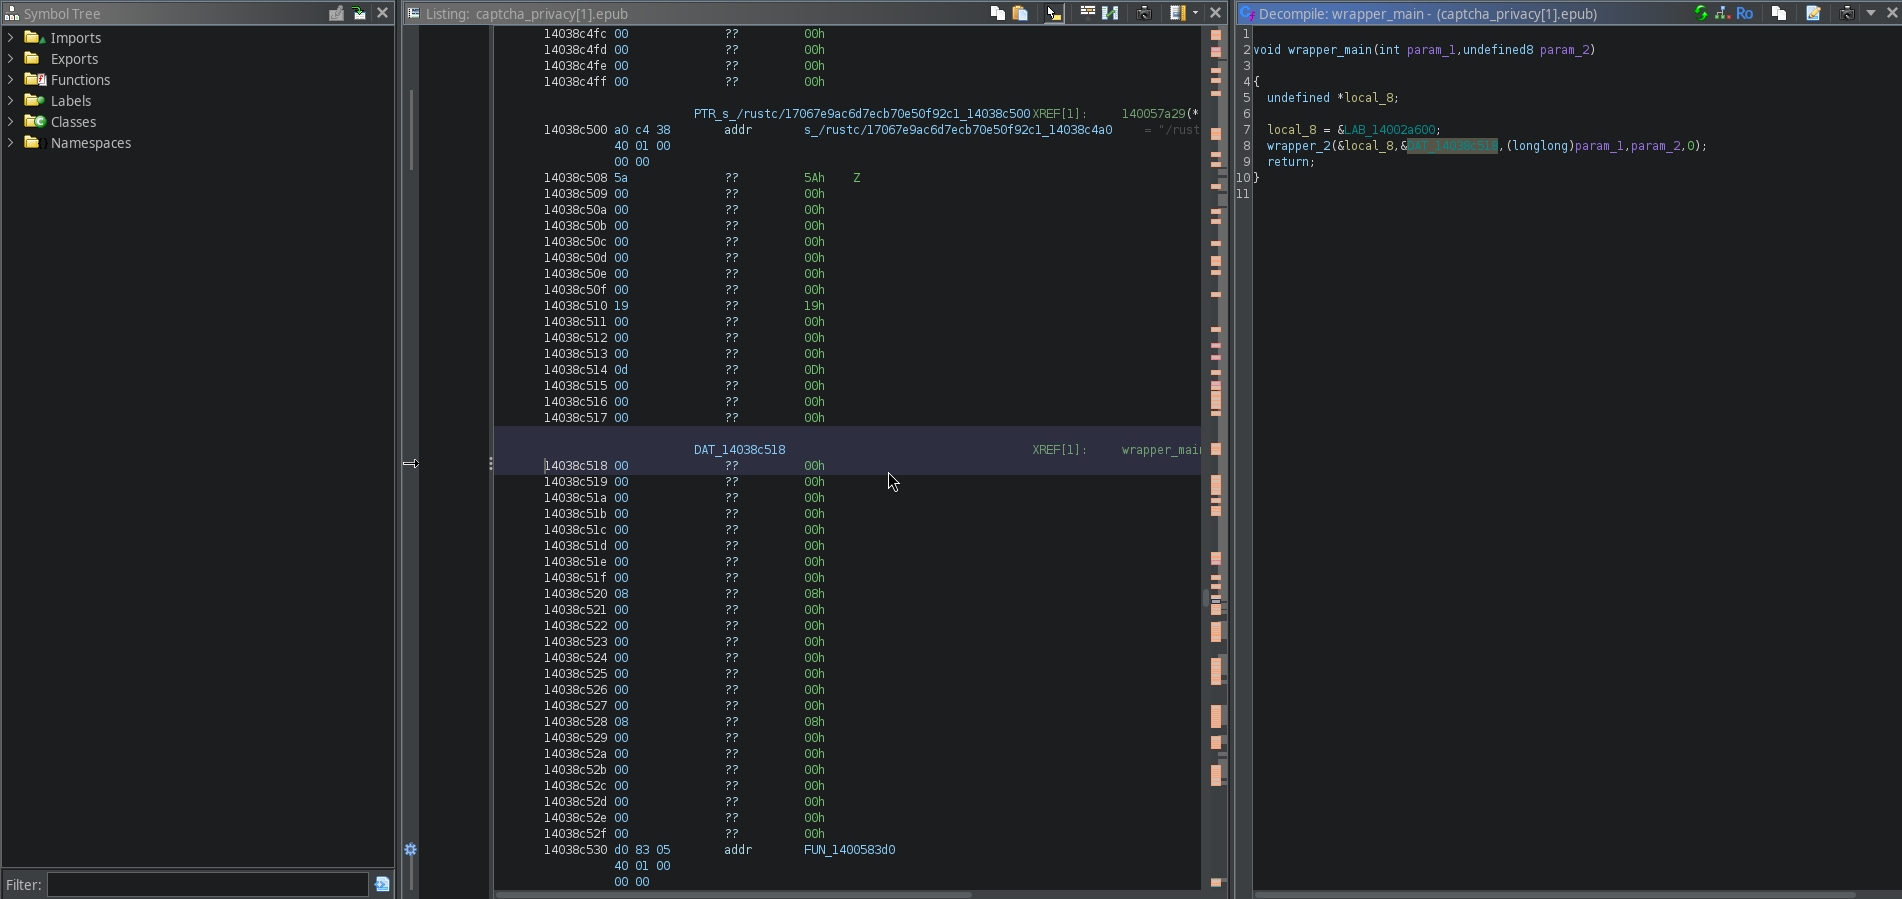
Looks like it's just zeroed out. Luckily, we are not searching directly for this, but instead this is just a base at which we will offset by our 0x28. So, what we can do is press G and enter the address of DAT_14038c518, and add our offset.
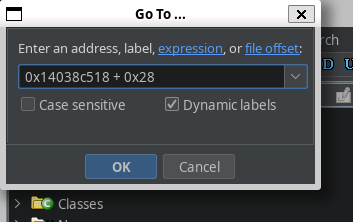
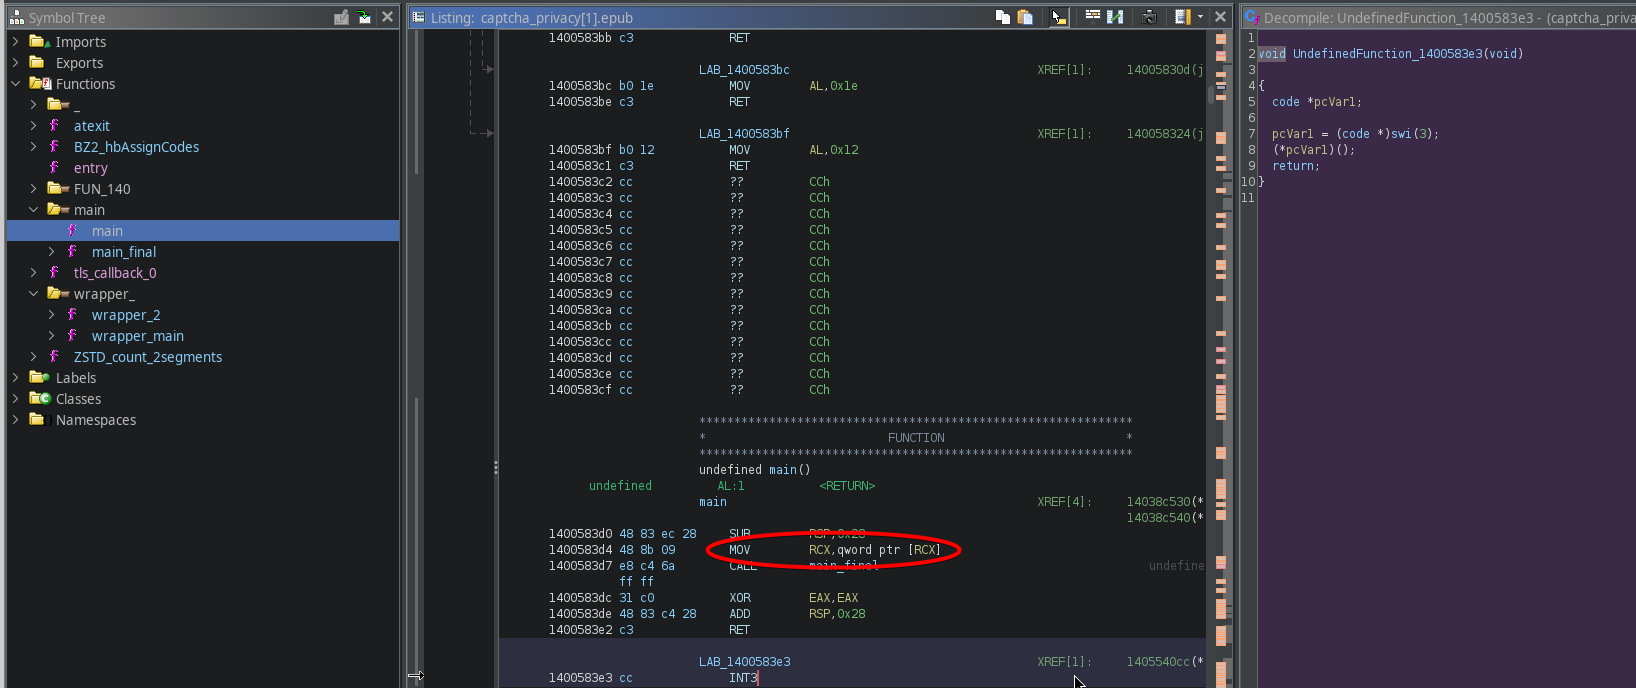
And we found a memory address at this location! Now, thanks to Ghidra, it shows as FUN_1400583d0, so we know there's a function here.
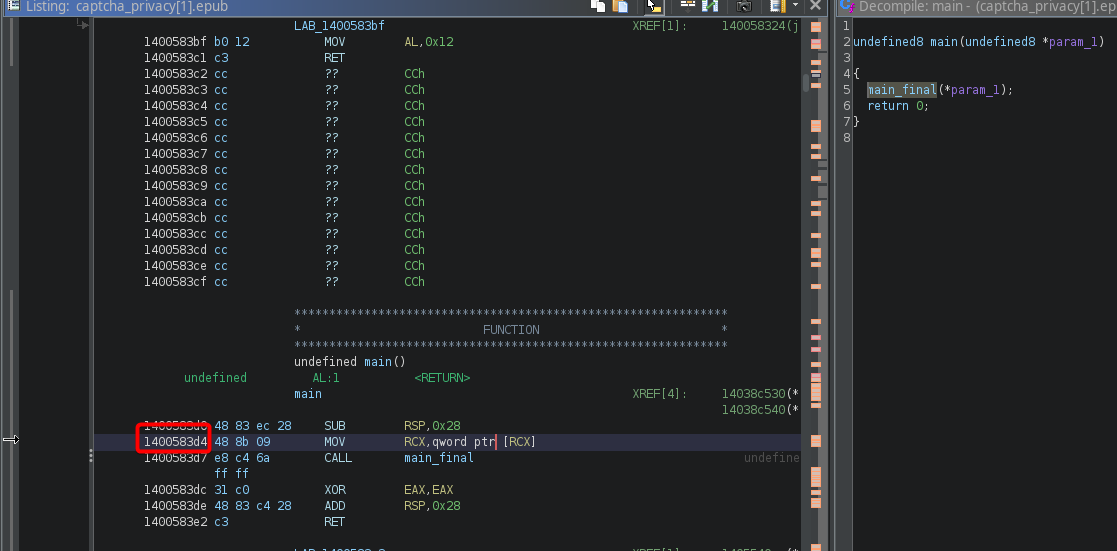
 Let's step into this function, and rename it to
 main while we're at it.
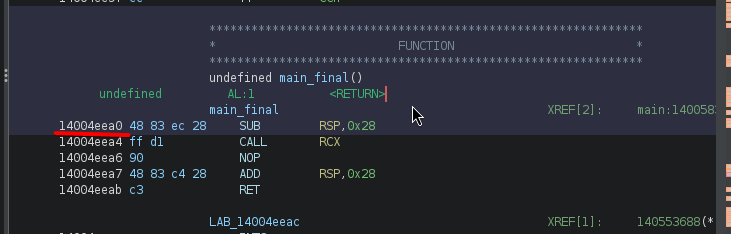
Excellent, another wrapper! Let's go ahead and follow FUN_14004eea0
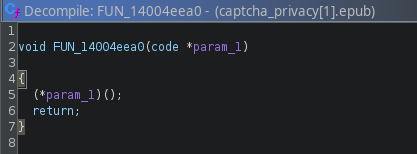 What's that? Another wrapper!? Great. But now we are at a crossroads. This wrapper looks different. What it is doing is essentially taking whatever data is stored in
 param_1, interpreting it as a memory address, and executing whatever is located there. So once again, we'll need to trace the origins of the parameter.
In other words, FUN_14004eea0(code *param_1) does (*param_1)(); invoke the function whose address is in param_1.
By just looking at the C code, we would not be able to trace where this variable comes from. However, when we look at the disassembled instructions, we see that the value is simply stored in the RCX register-
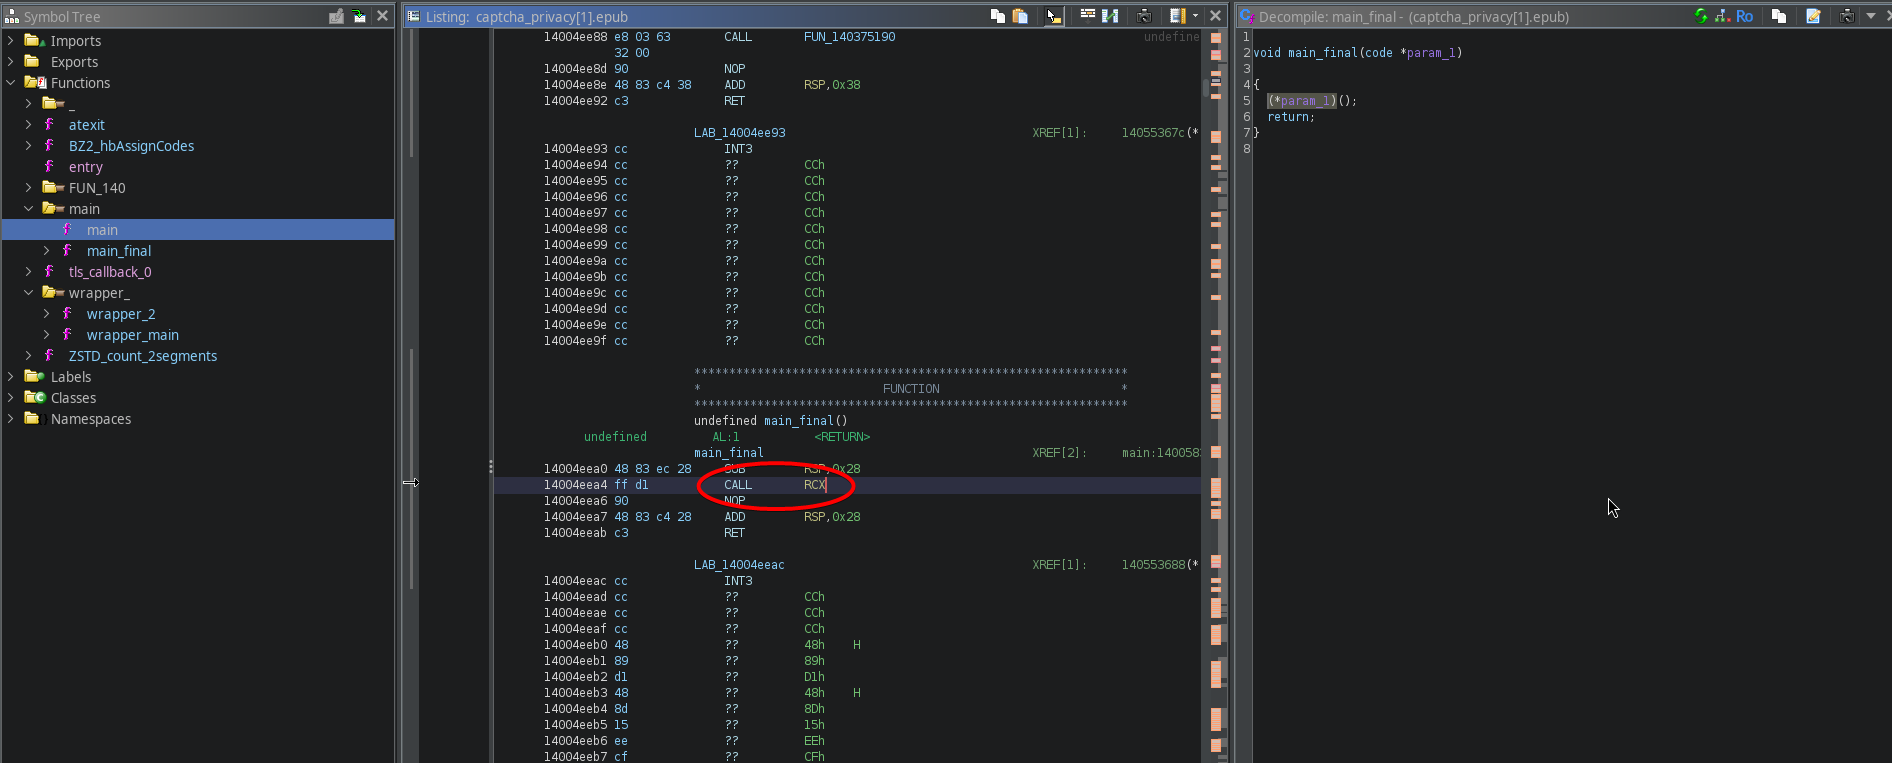
And indeed, the previous wrapper layer prepared this register to be read:
Now we're at a bit of a standstill- we need to find what's in the RCX register, but these only exist at runtime, so we will need to debug the program and set a breakpoint at this location, which should be easy since we have the address of the function we want to break at.
Because this program is a PE32 executable and not ELF binary, we cannot use Ghidra or gdb to debug it (my programs of choice for this type of work), but will instead need a windows debugger. My go-to windows debugger is x64dbg.
The work we need to do in the debugger is fairly minimal- we are just looking to inspect the memory at a certain breakpoint. So, I won't bother explaining too much here and instead just go over the high level details.
The first thing to notice is the different addresses on the left- because of this, we cannot simply set a breakpoint at 0x14004eea0. The reason for this difference is the difference in how the program is loaded.
- Ghidra analyzes the file statically. It uses the image base recorded in the PE header (e.g.
0x140000000) as the start of all virtual addresses. - x64dbg shows addresses after Windows has loaded the program. Windows’ loader applies Address Space Layout Randomization (ASLR), so it maps the image at a random base (e.g.
0x00007FF6C3E51000).
Since we won't be able to do it the easy way, we can instead just use relative offsets. If we go back to Ghidra, we can scroll all the way up to view the base address used:
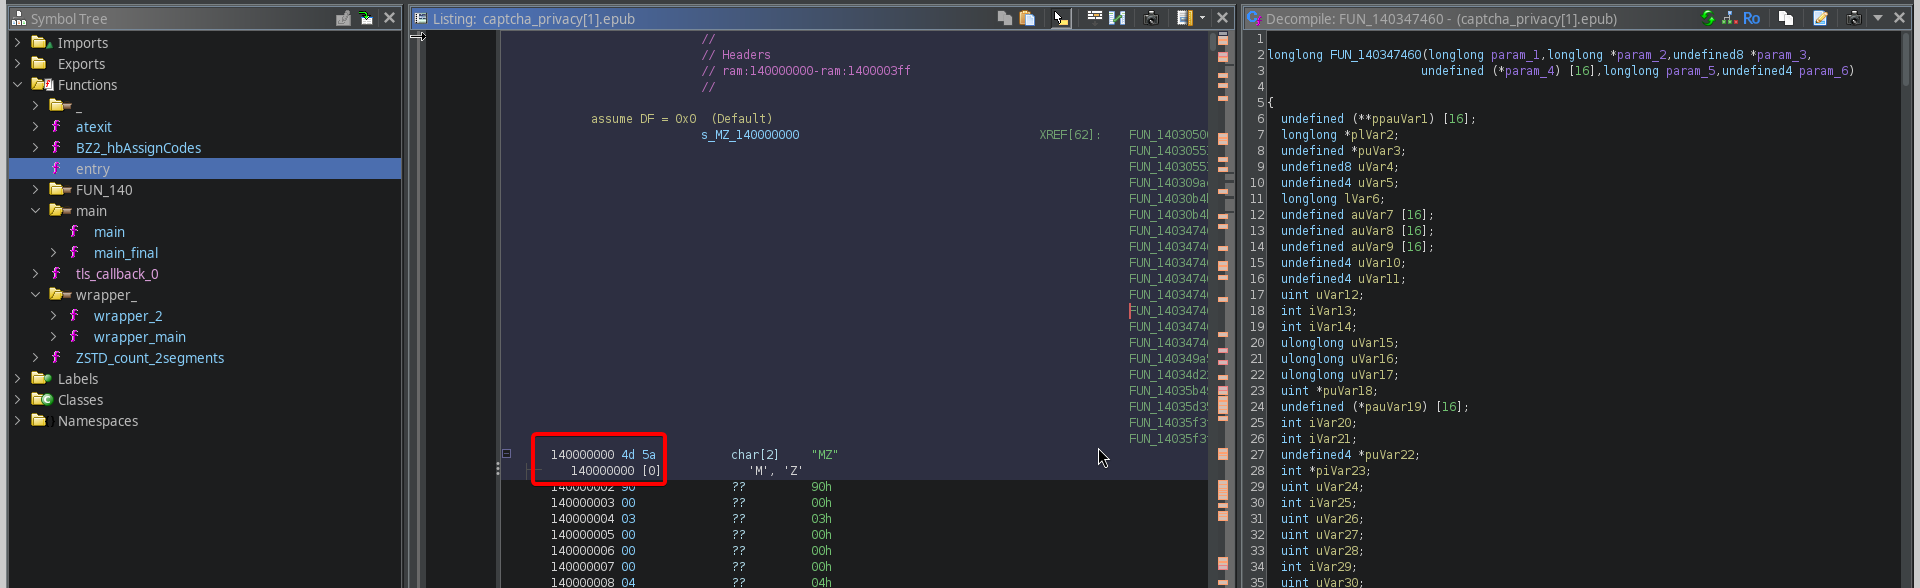
Then to find the offset of our function we just subtract that from our function address:
0x14004eea0 - 0x140000000 = 0x4eea0
However, since we want to actually pause and inspect the contents of RCX before the function is called, I'll actually just grab this address instead:
 Which is at offset
 0x583d4
To get the base address of our exe in x64dbg, we can open the memory map tab and see where it's loaded.
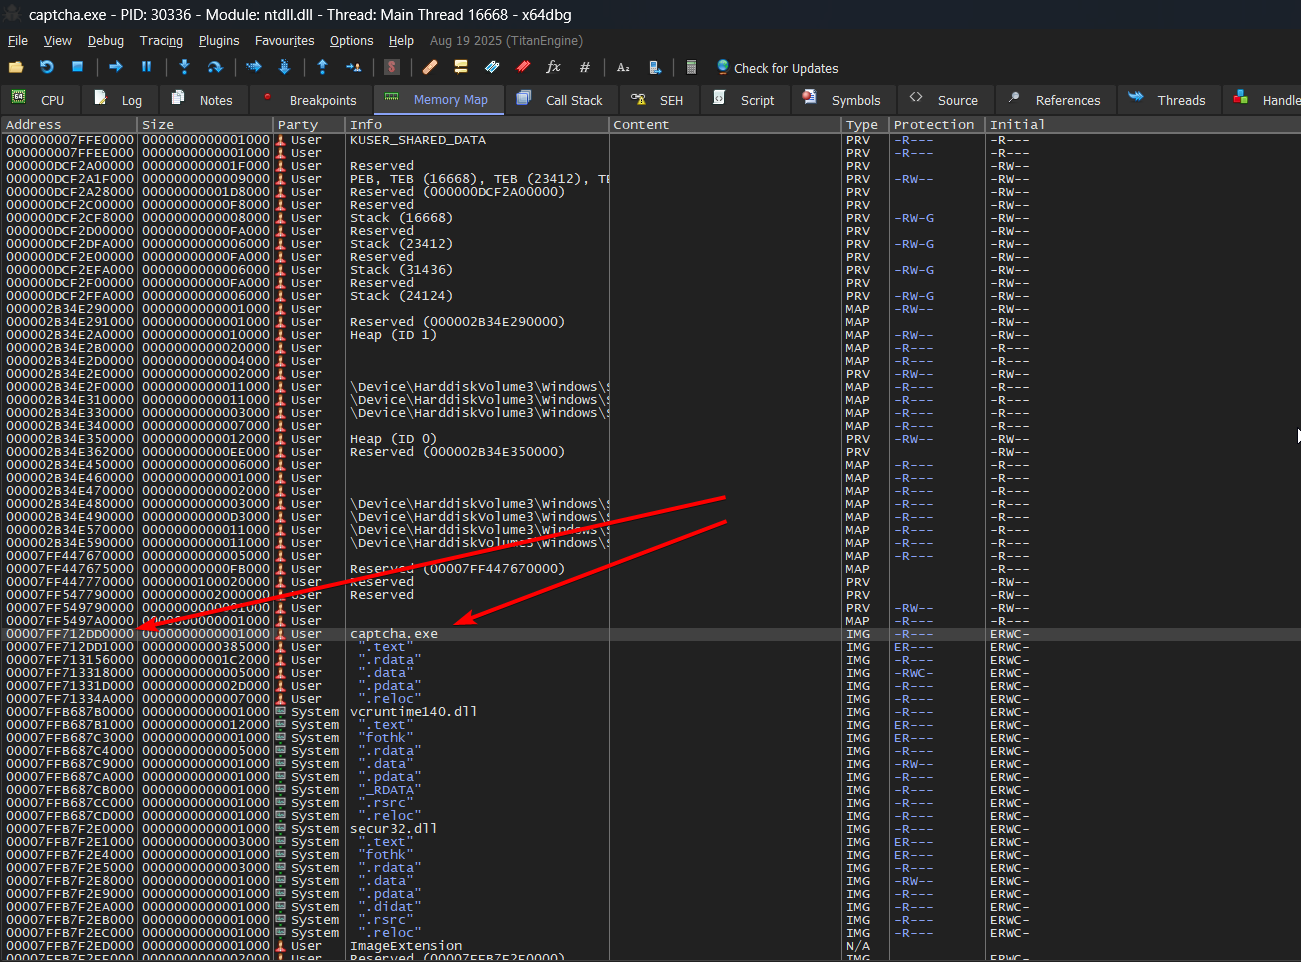
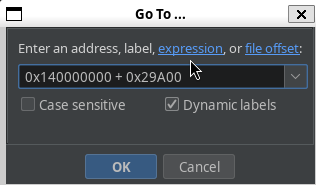
Fortunately, we don't actually need to do math and can just insert it as a command in x64dbg to visit this offset:
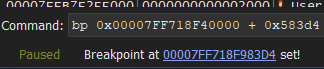
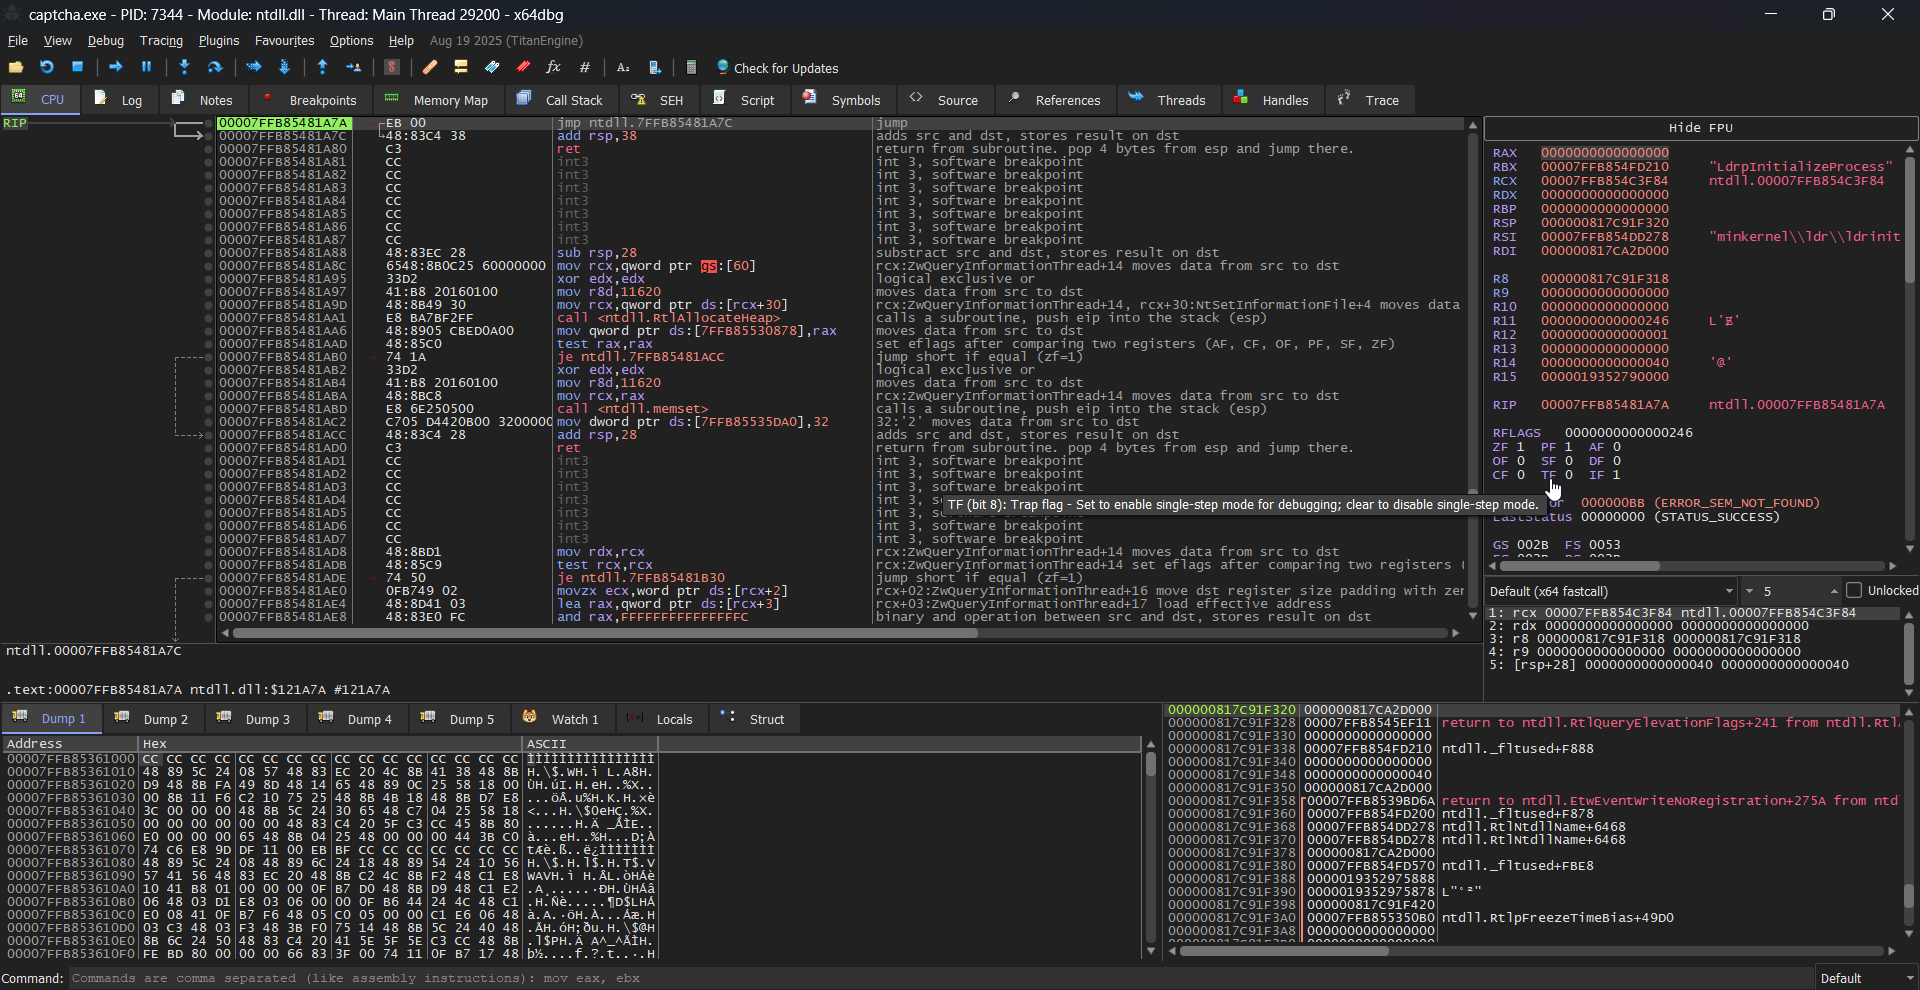
Then we can resume execution and hit this breakpoint
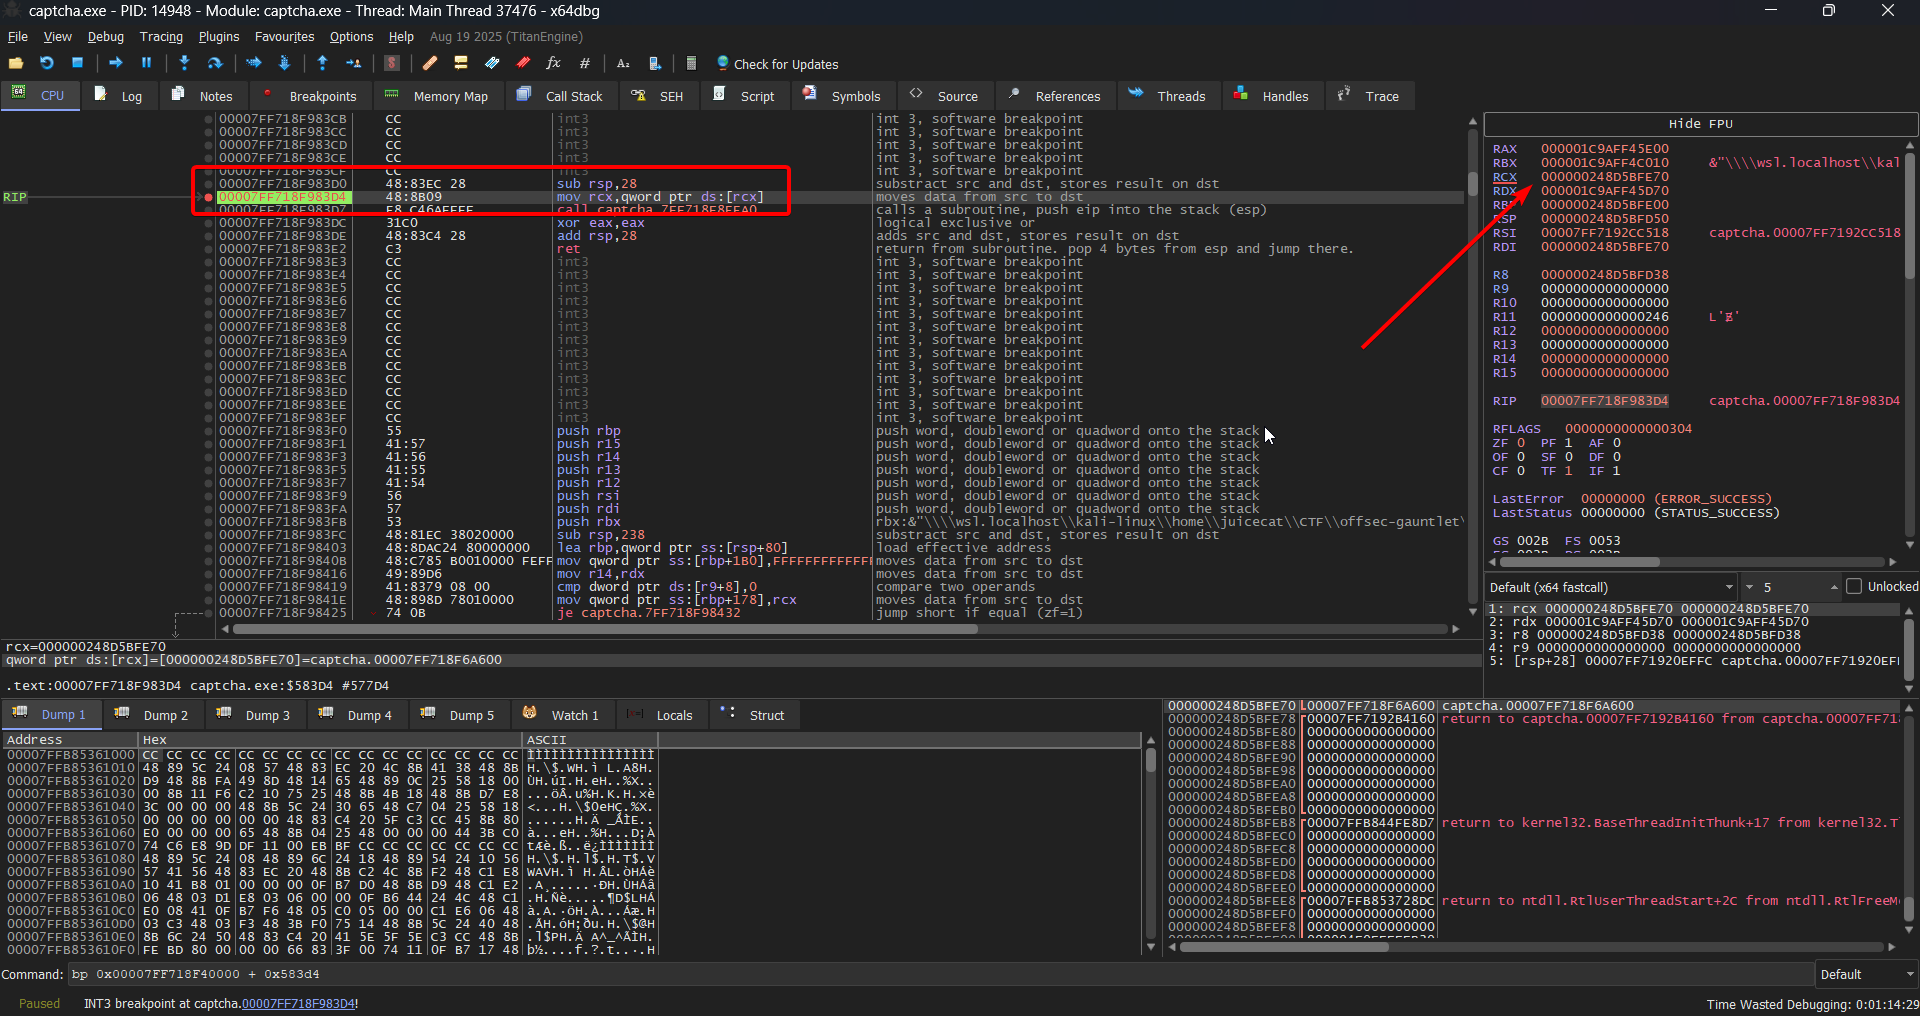 Indeed, we see that the disassembled instructions match that which we were viewing in Ghidra as well. From here, we can inspect the memory contents on the right, which gives us the
 RCX value:
0x000000248D5BFE70
But hold on.. This doesn't make sense. We are expecting a function pointer to be in this register, and this value is under our base offset. In this case, we actually paused right BEFORE RCX is set- So we can just step forward by one instruction and we see that the RCX contents change to something that looks more correct:
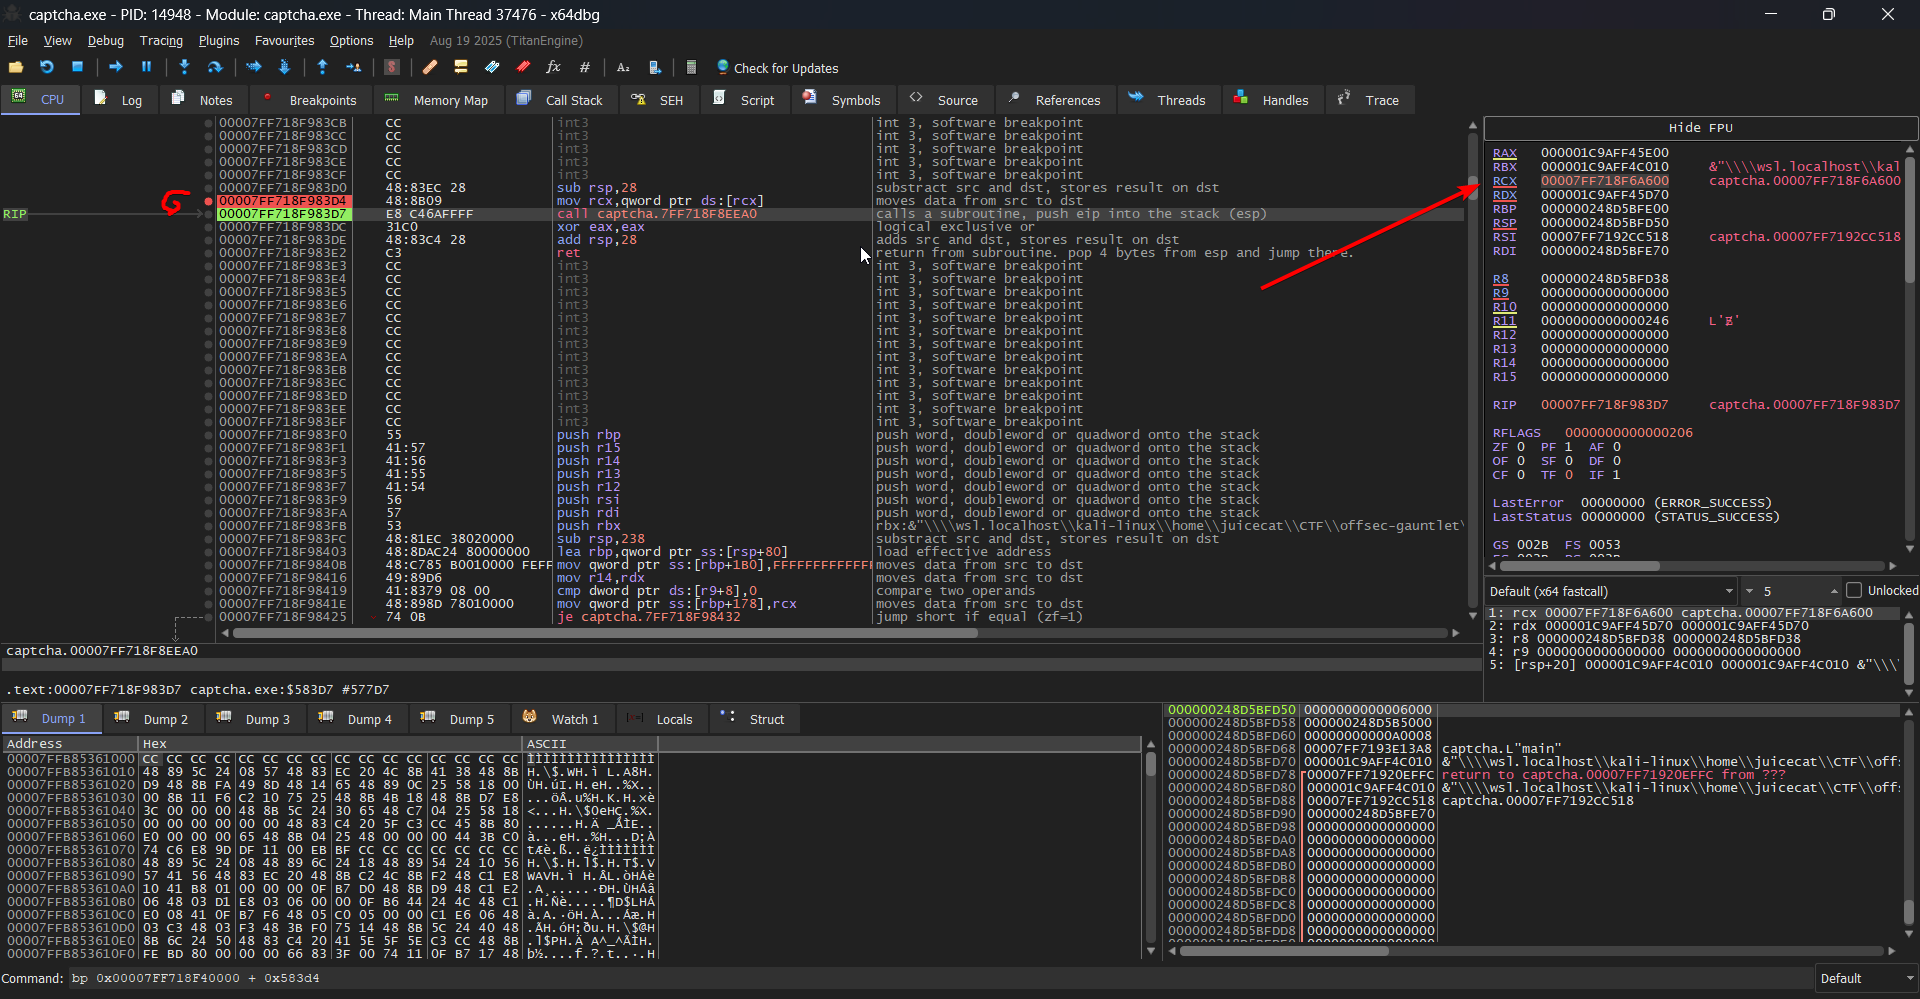
0x00007FF718F6A600, which matches our offset. We can right click this value and follow it to the dump window, in which we can right click on the memory address and copy it's file offset
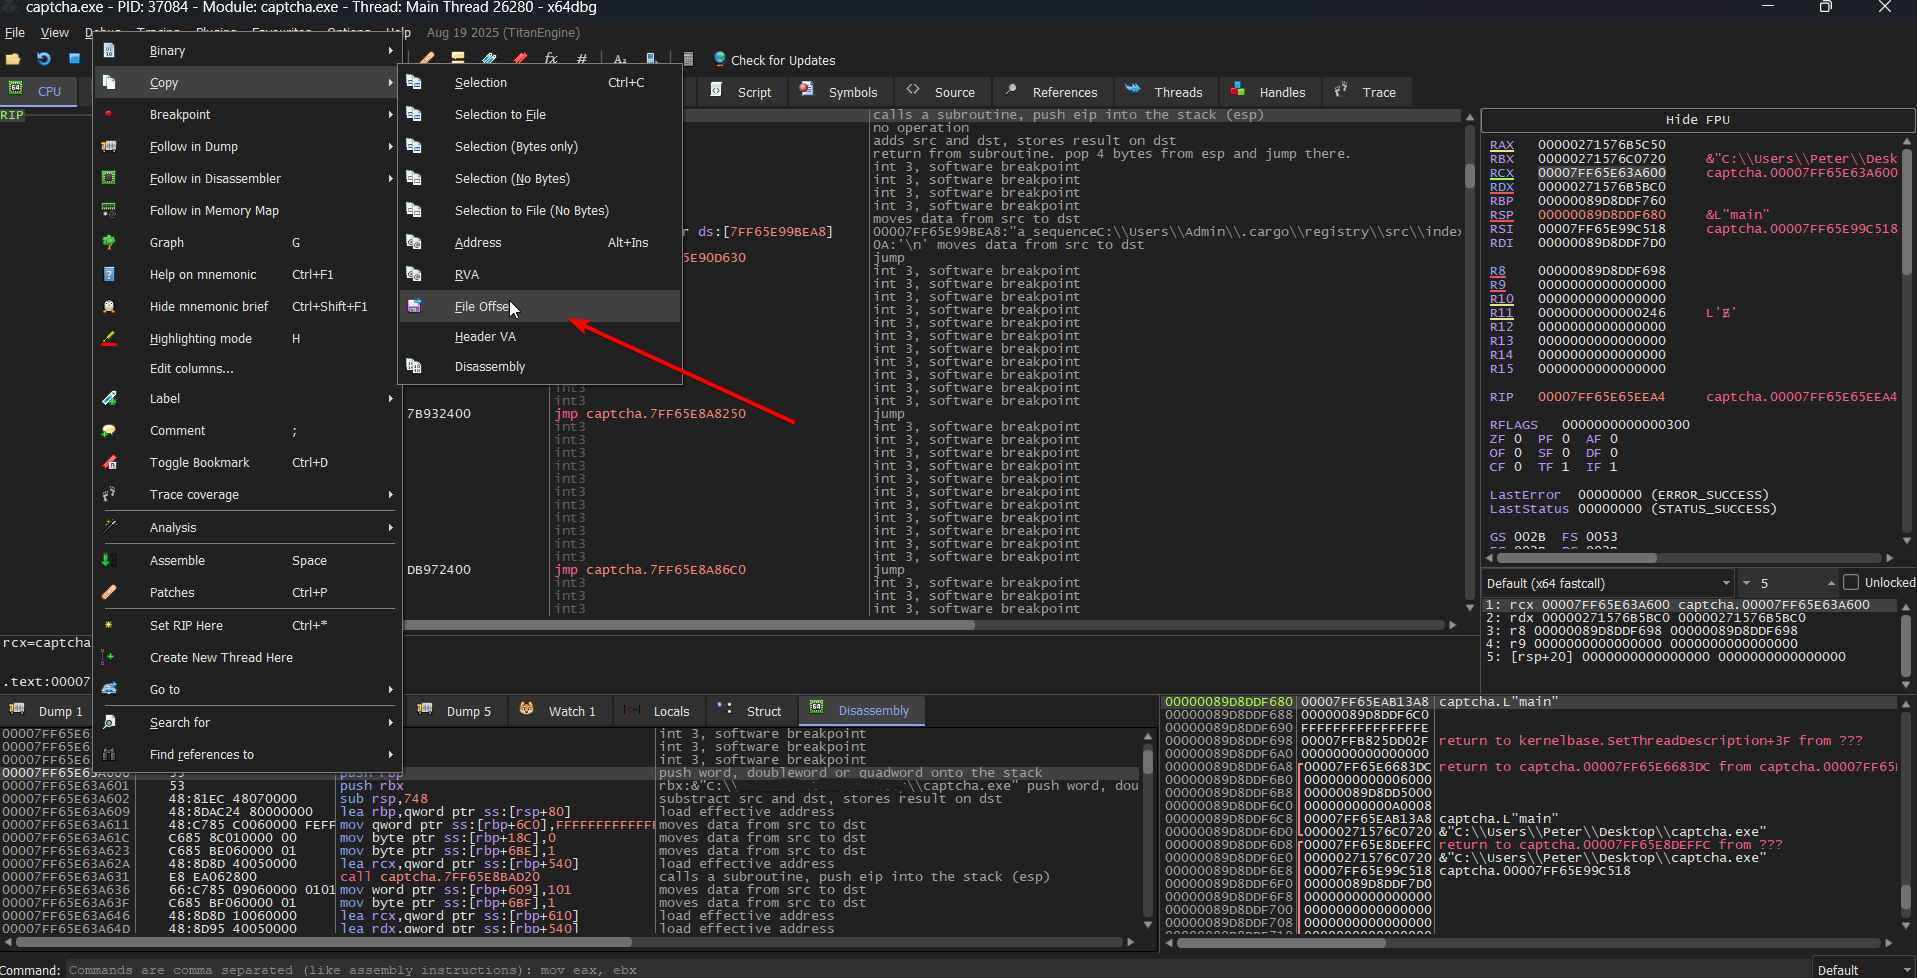
Which gives us: 0x29A00. In Ghidra, we can navigate to this offset:
Which is a very sus function.
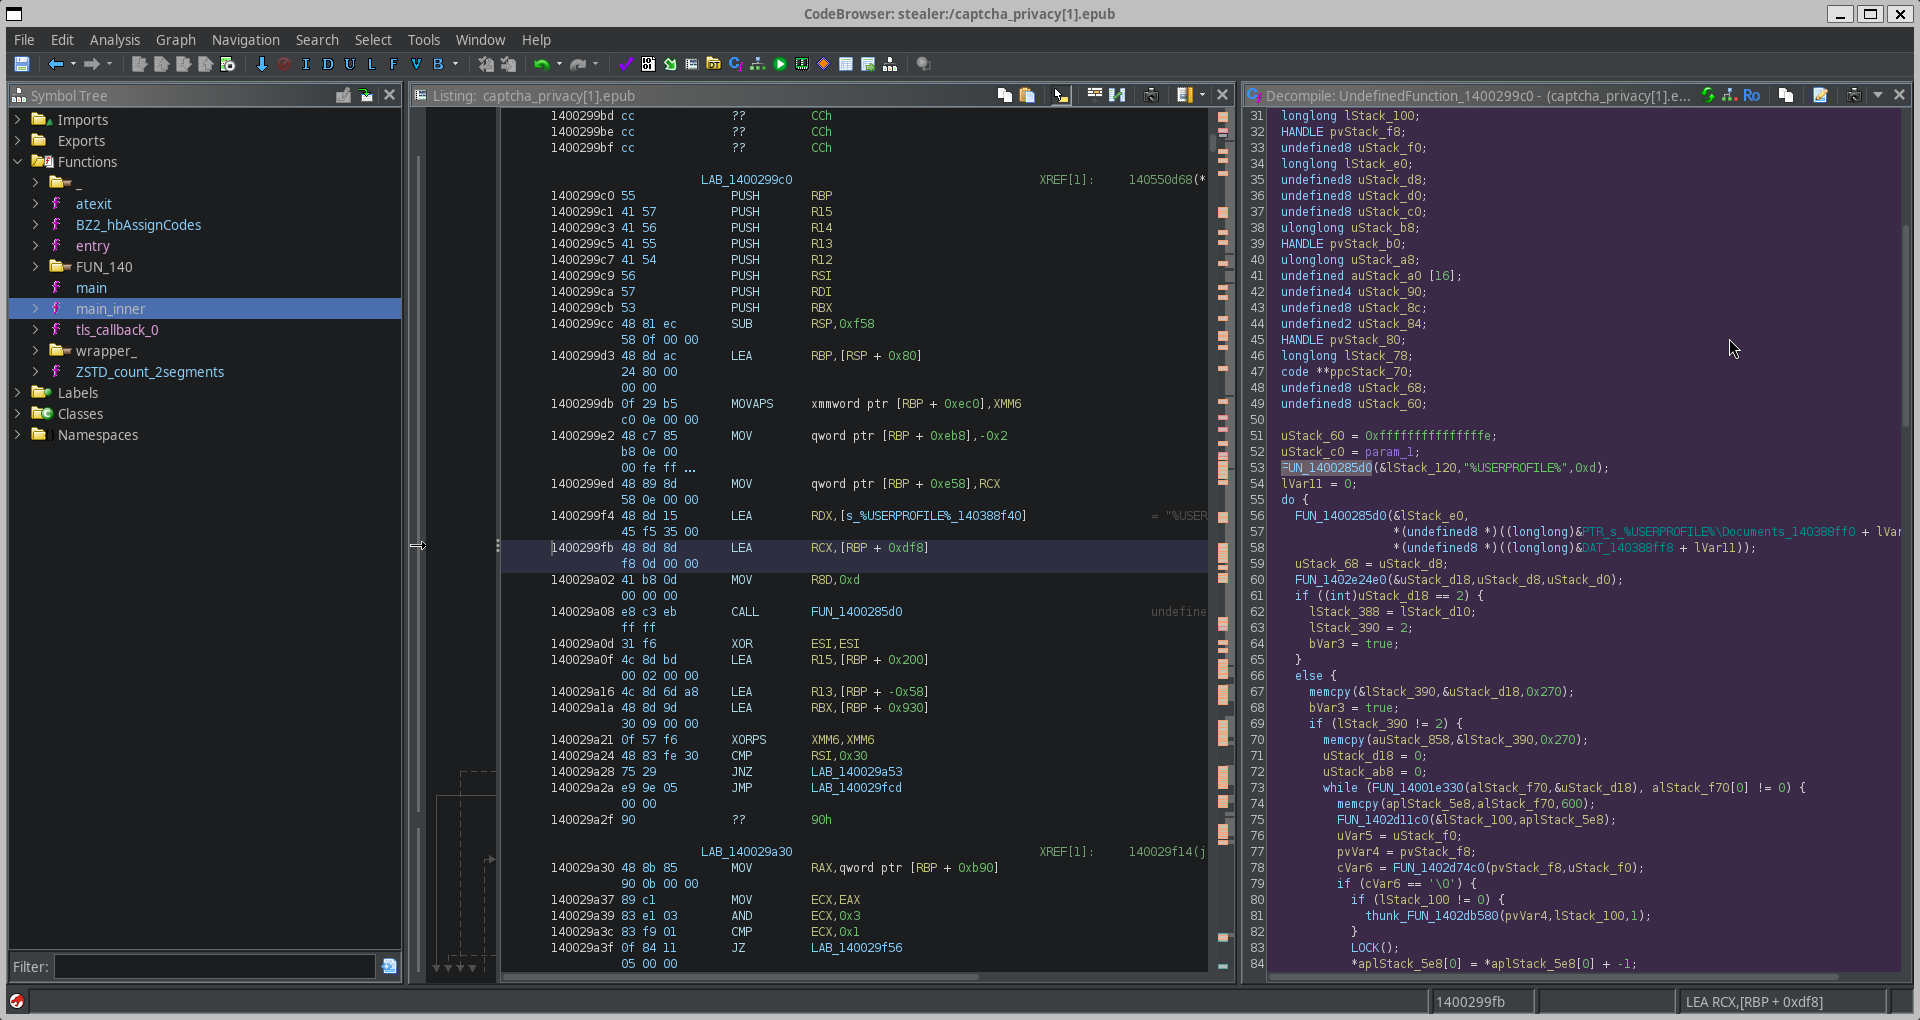
Inside we see loads of very interesting things that indicate enumeration, such as the following line:
    FUN_1400285d0(&lStack_e0,
                  *(undefined8 *)((longlong)&PTR_s_%USERPROFILE%\Documents_140388ff0 + lVar11),
                  *(undefined8 *)((longlong)&DAT_140388ff8 + lVar11));
Which looks like it iterates over user data- which makes sense given the malicious context of this file.
For the sake of digestibility, this investigation will continue in another blog post. But for now, we've discovered the basic mechanisms of this piece of malware